
 Featured
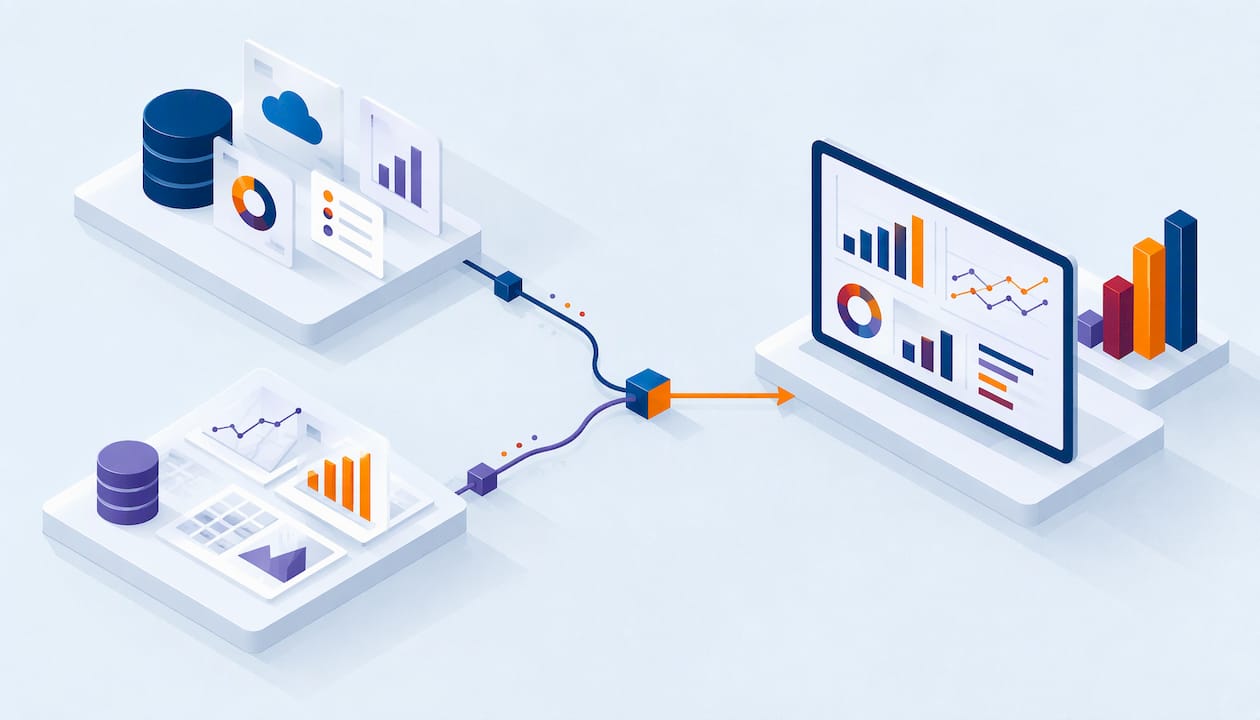
Tableau Salesforce Integration: Connect, Refresh, Combine
Your pipeline report in Salesforce says one number. Your finance dashboard says another. Leaders stop trusting both, and the weekly meeting turns into an argument about data. Connecting Tableau to…
Read article
Healthcare Predictive Analytics: Uses, Data and Evidence
Your team has a risk score, and nobody acts on it. The numbers arrive late, they disagree with the finance report, or clinicians stop trusting the alerts. This is the usual way healthcare…
Read article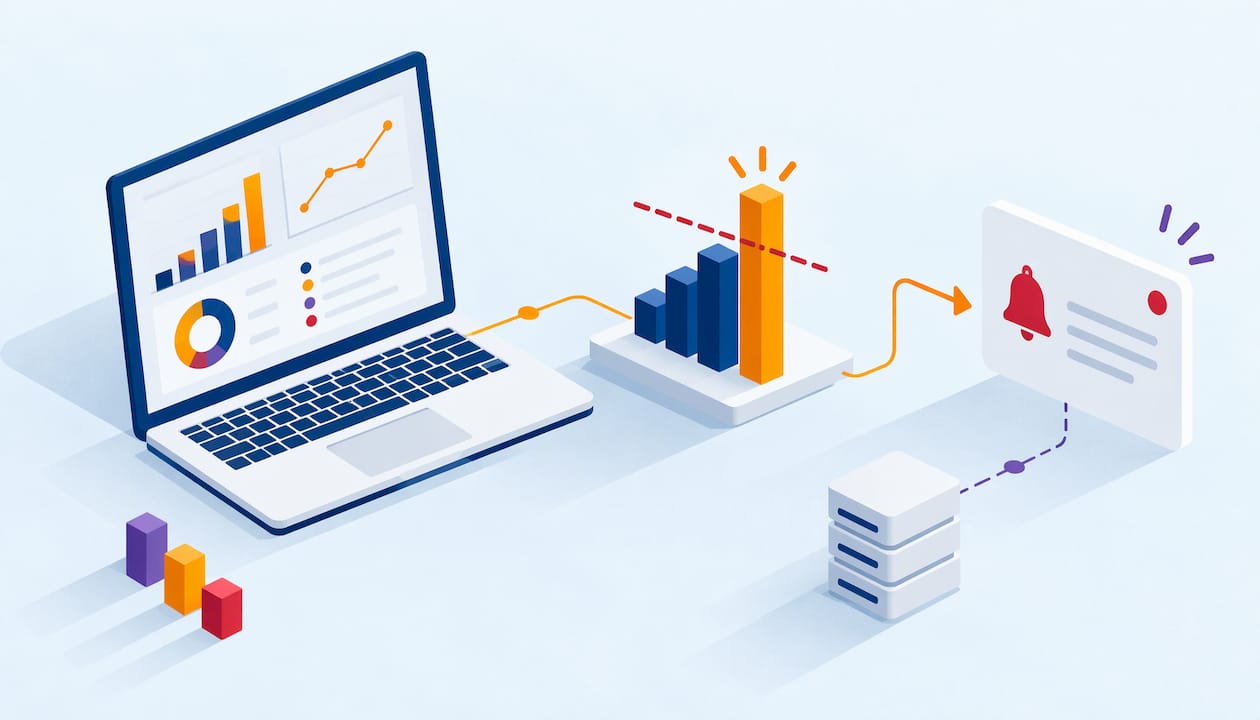
Power BI Data Alerts: Setup, Limits and Fixes
You check the dashboard every morning to see whether a number crossed a line. Overdue invoices, open cases, inventory below a minimum. Power BI data alerts do that checking for you and send a…
Read article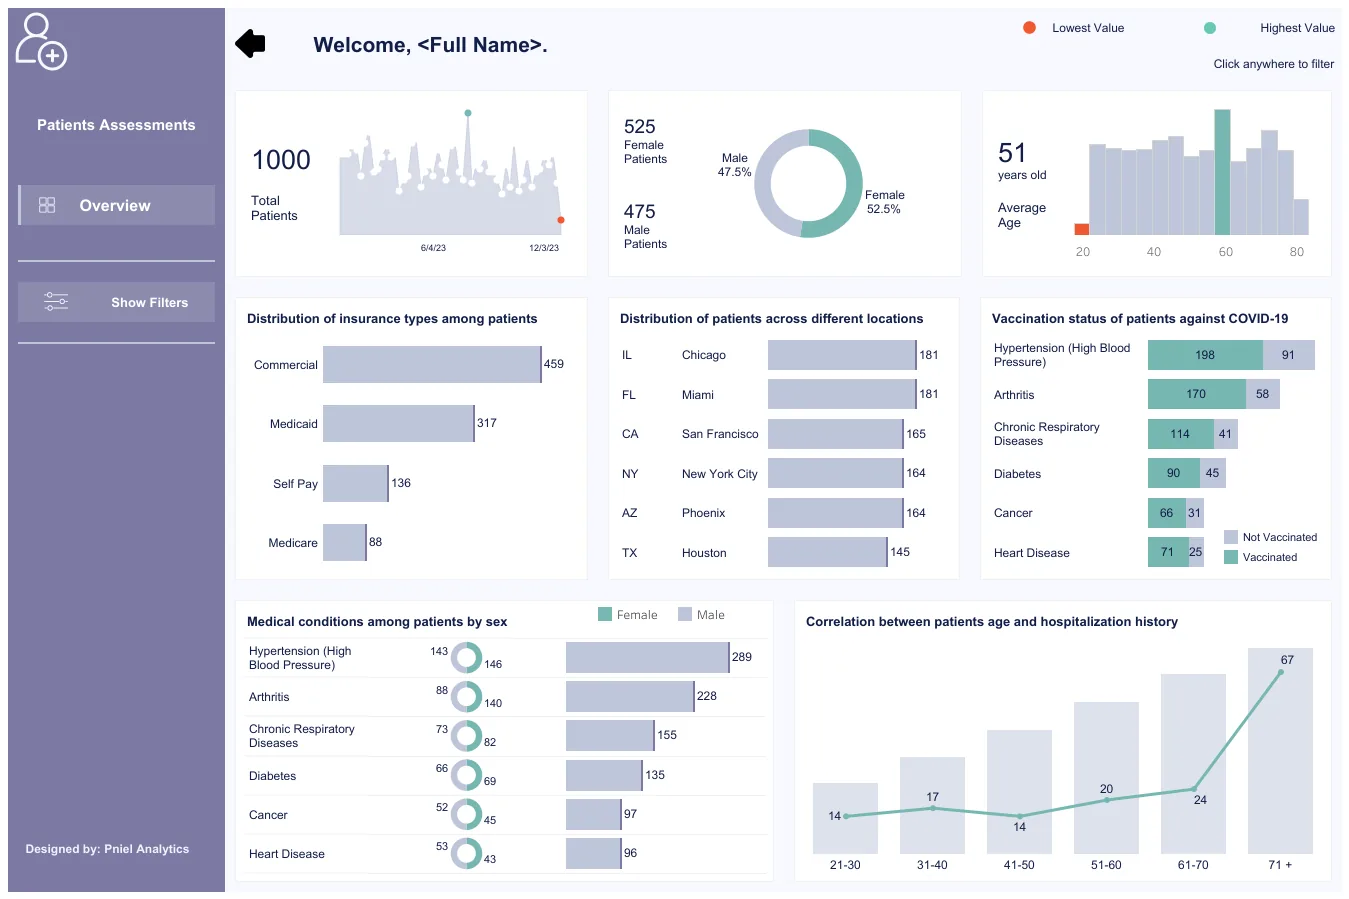 Dashboards & Adoption
Clinic Executive Dashboard: KPIs, Layout and Example
The KPIs clinic leaders put on an executive dashboard, a recommended one-page layout, Tableau vs Power BI notes, data sources and common pitfalls — using sample data only.
Read article
How to Connect Power BI to Salesforce (and When to Use SQL Server)
Your sales leaders want pipeline numbers in Power BI. The Salesforce report says one total and the dashboard says another. Or the refresh fails on Monday morning, right before the forecast…
Read article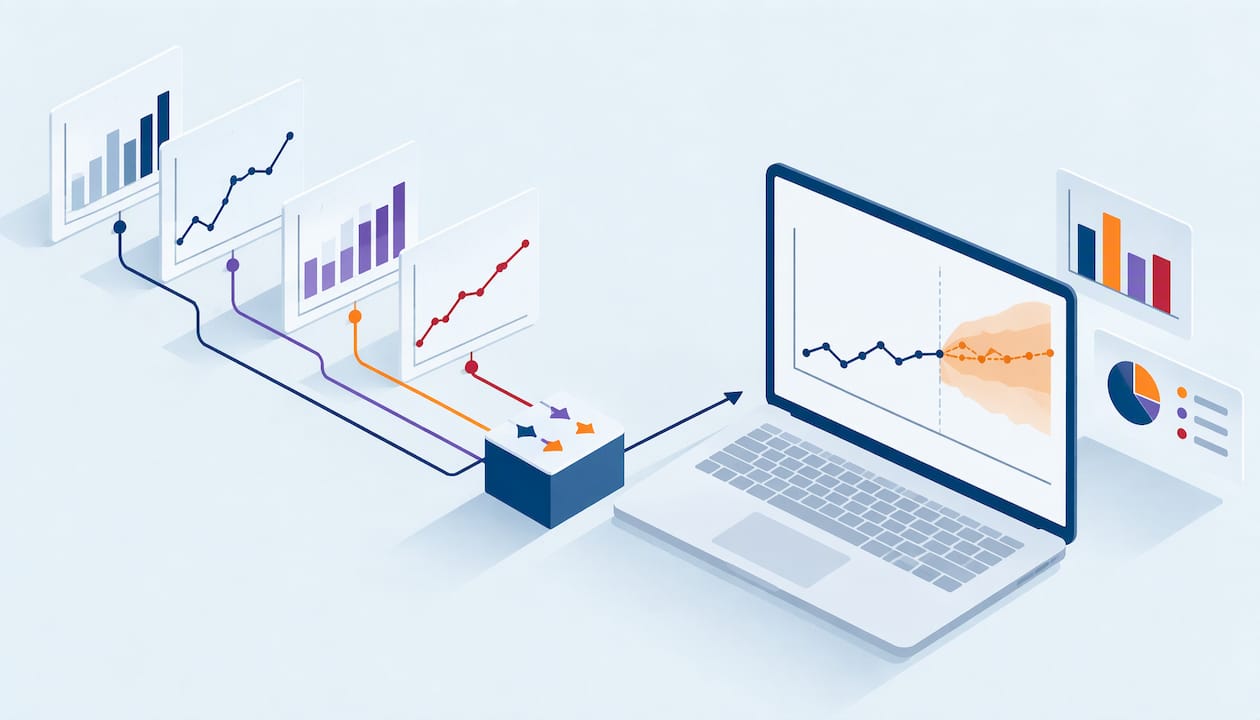
Tableau Forecasting: Build, Tune and Check a Forecast
Your monthly revenue line looks fine until you turn on the forecast. Then the projection shoots up, flattens, or throws an error. Most of the time the cause sits in the data, not in the chart.…
Read article Business intelligence
DirectQuery vs Import in Power BI: How to Choose
Your Power BI report is slow, or its numbers are stale, and someone suggests switching the storage mode. That switch can fix the problem or make it worse. The right answer depends on how big your…
Read article
Dashboard Design Principles for Clear, Fast Decisions
You open the weekly dashboard and cannot tell if the month is on track. Too many charts compete for attention. Two numbers disagree with last week’s report. Filters take ten seconds to load.
Read article
Balanced Scorecard Dashboard: How to Design and Build One
A balanced scorecard dashboard shows your strategy on one screen. It groups a small set of KPIs under four perspectives: financial, customer, internal process, and learning and growth. Each KPI…
Read article
Power BI Forecasting: How to Build and Check a Forecast
Power BI can forecast with one click. Select a line chart with a date axis, open the Analytics pane, turn on Forecast, and the chart extends into the future with a shaded confidence band. The…
Read article
Finance Data Governance: A Practical Guide for US Teams
Finance data governance is the set of decisions, owners, rules and controls that determine how financial data is defined, accessed, protected, changed and used for reporting. It answers plain…
Read article
Anomaly Detection Dashboard: How to Build One in Power BI or Tableau
An anomaly detection dashboard shows you which numbers moved in a way they normally do not, and helps you find out why. It marks the unusual point, shows the range you expected, and lets you click…
Read article
Dashboard Automation: How to Build Reports That Update Themselves
Dashboard automation means your numbers refresh, reach the right people and flag problems without someone rebuilding a report each week. The software is the easy part. The harder part is agreeing…
Read article
Tableau Row Level Security: Methods, Setup and Pitfalls
Row level security (RLS) in Tableau controls which rows of data each person sees in the same dashboard. A regional manager sees her region. A finance lead sees every region. Nobody has to build a…
Read article
Row Level Security in Power BI: Setup, Dynamic Roles, Testing
How row level security (RLS) works in Power BI: static and dynamic roles, DAX filters, the Viewer role trap, and how to test RLS properly before you share a report.
Read article
Incremental Refresh in Power BI: Setup, Limits and Pitfalls
How Power BI incremental refresh works, how to set it up with RangeStart and RangeEnd, the licensing and refresh limits to know, and the mistakes that cause slow or failed refreshes.
Read article
Manufacturing Production Dashboards: Plant Teams, Start With a Pilot
How plant teams build manufacturing production dashboards that get used: choose the right KPIs, lay out shop-floor, supervisor and executive views, and roll out with a focused pilot.
Read article
Data Pipeline Monitoring: What to Track and How to Start
A practical guide to data pipeline monitoring: the four metrics to track first, the content checks that catch silent failures, and how to start without buying a pile of tools.
Read article
Data Quality Management for Data Leaders: Build Beyond the Taxonomy
An ongoing program of people, process and tools that keeps your data fit for purpose, with the dimensions, KPIs and steps to build a working DQM program.
Read article
Data Strategy Roadmap: Start With a 60 to 90 Day Pilot
A sequenced plan that connects business goals to data, governance and technology, starting with a readiness check and a time-boxed 60 to 90 day pilot.
Read article
Analytics Maturity Assessment: Five Stages, Then an Action Plan
A structured way to score how your organization uses data across five stages and five dimensions, then turn the gaps into a prioritized, measurable roadmap.
Read article
Tableau to Power BI Migration: Model First, Then a Phased Rollout
Audit your Tableau estate, prove it out on one dashboard, then build a semantic-model-first Power BI architecture and migrate in phased waves to limit risk.
Read article
Copilot in Power BI: 6 Setup Checks Before Teams Rely on It
Before you let anyone trust Copilot in Power BI, run these six checks on tenant settings, capacity, your semantic model, DAX, governance, and verification.
Read article
ETL vs ELT: How to Decide in 4 Questions
ETL transforms before load; ELT loads raw then transforms in the warehouse. A practitioner checklist for choosing per source, with governance and cost notes.
Read article
3 Metrics Teachers Should Track in a Student Performance Dashboard
The three classroom metrics that actually drive action — grade trend, attendance risk, and mastery by standard — plus a FERPA-aware way to build the dashboard.
Read article
Cut Power BI Latency: 5 Decision Questions to Pick Star or Snowflake Schema
Tool-aware guidance for BI developers. Use a 5-question checklist to decide star or snowflake schema, prototype queries, and speed up Power BI dashboards.
Read article
Data Teams: Turn ISO and ETSI Rules into Data Quality Metrics
Turn ISO and ETSI standards into measurable data quality metrics: formulas, thresholds, scorecard patterns, and a short healthcare example.
Read article
Decide in Two Weeks: 6 Fabric Questions to Pick Lakehouse or Warehouse
Use six targeted Microsoft Fabric questions and a two-week scoping test to choose a lakehouse, warehouse, or hybrid architecture that fits your analytics team.
Read article
6 Copy-Ready Executive Dashboard Examples for the C-Suite
Six ready-to-use executive dashboard templates for the C-suite: KPIs, layouts, and a data-first process that fixes dashboard bottlenecks before design.
Read article
Power BI for FP&A: How to Build an FP&A Dashboard
A hands-on Power BI playbook for FP&A teams: build budget, forecast, and scenario dashboards in five steps, with examples, common pitfalls, and a client case.
Read article
Ship Trustworthy Tableau Executive Dashboards in Weeks: 4 Templates
Governance-first Tableau executive dashboards: four templates, a seven-step implementation checklist, and how we build executive reporting teams actually trust.
Read article Healthcare Analytics
A Playbook for Healthcare KPI Dashboards
The metrics that actually matter in healthcare, how to structure a dashboard clinicians and executives both trust, and how to handle fragmented systems and patient data along the way.
Read article
A Procurement-Ready Executive Checklist for Power BI Embedded Analytics
A procurement-ready checklist for executives buying consultancy-led Power BI embedded analytics: POC timing, technical readiness, and how to measure success.
Read article Pricing & Hiring
How Much Does a Tableau Dashboard Cost in 2026?
Real Tableau dashboard pricing by complexity, the four hidden cost drivers, license fees, and what US businesses and agencies actually budget in 2026.
Read article
3 Authentication Patterns for Tableau Embedded Analytics in Executive Portals
An executive guide to embedding Tableau in internal portals: three authentication patterns (JWTs, OAuth, trusted tickets) and the performance decisions that matter more.
Read article
Stop PHI Leaks: 9 Steps for HIPAA-Compliant Analytics in Health IT
Practical US steps to secure analytics for healthcare teams: BAAs, server-side PHI filtering, access controls, and a nine-step operational checklist.
Read article
How to Build a Month-End Close Dashboard
A month-end close dashboard puts every close task, exception, and reconciliation in one audit-ready view, so your team closes faster, catches errors sooner, and stops chasing status by email.
Read article
5 Signs Your Reporting Has Outgrown Spreadsheets
When a weekly spreadsheet quietly turns into a part time job, it's usually time for a dashboard. Here are five clear red flags to watch for, and a look at when Excel is still the right tool for the job.
Read article
How to Tell If Your Dashboard Data Can Be Trusted
A non-technical checklist for judging whether a dashboard's numbers can be trusted, from source ties and refresh dates to definitions, filters and ownership.
Read article
Why Your Team Stopped Opening the Dashboard
Most dashboards fail because of unclear decisions, numbers that don't match and slow load times, not design. Here's how Pniel Analytics builds reports people use.
Read article
What Does a Tableau Consultant Cost?
Real 2026 ranges for hourly, project, and retainer work, what pushes the number up or down, and how to tell whether a cheap quote will end up costing you more.
Read article
Tableau vs Power BI in 2026: Which Is Right for Your Business?
A vendor-neutral 2026 comparison of Tableau and Power BI: real license costs, learning curve, data modeling, visuals, governance, plus guidance by team size and stack.
Read article