
A balanced scorecard dashboard shows your strategy on one screen. It groups a small set of KPIs under four perspectives: financial, customer, internal process, and learning and growth. Each KPI has an owner, a target and a status. Leaders review it monthly or quarterly to see whether the strategy is working, not just whether today’s numbers moved.
This guide explains how it differs from an operational dashboard, which KPIs to put in each perspective, how public-sector teams adapt the framework, and how to start one in Power BI.
TL;DR
- A balanced scorecard dashboard tracks strategy across four perspectives. An operational dashboard tracks daily activity. You usually need both.
- Pick few KPIs. Each one should have a strategic reason to connect to your goal, a named owner and a target.
- Government and nonprofit teams can rename the perspectives. Stewardship replaces profit, and stakeholders replace customers.
- Power BI Service has a scorecard feature with goals, owners, targets and statuses. Tableau works well too when the data model is sound.
- Most failures come from the data behind the dashboard, not the visuals. Fix definitions and pipelines first.
Turn your data into decisions
We build Tableau and Power BI dashboards and the data models behind them. Book a free 30-minute analytics assessment and we'll map the fastest path for your team.
Book a Free Analytics AssessmentOn this page
- What a balanced scorecard dashboard is
- Balanced scorecard vs. operational dashboard
- The four perspectives and the KPIs that fit
- Choose fewer KPIs, and choose them for a reason
- Targets, owners and cadence
- Examples by organization type
- Design rules for the dashboard itself
- Building a scorecard in Power BI
- Where scorecard projects go wrong
- Our perspective
- Get help building yours
- FAQ
- Sources
What a balanced scorecard dashboard is
The balanced scorecard is a management framework. Harvard Business School Online describes it as a way to combine financial measures with customer, internal business process, and learning and growth perspectives. It credits Robert Kaplan and David Norton with developing it in 1992.
The idea is simple. Financial results are a lagging view. They tell you what already happened. The other three perspectives show the drivers behind those results. A balanced scorecard dashboard puts all four in one view so leaders can see how they connect.
The dashboard part is the delivery format. Instead of a slide deck assembled by hand each quarter, the scorecard is a live report that pulls from your source systems, compares each measure with its target and flags what needs attention.
Balanced scorecard vs. operational dashboard
These two tools are often confused. They answer different questions.
| Balanced scorecard dashboard | Operational dashboard | |
|---|---|---|
| Question | Are we executing our strategy? | What is happening right now? |
| Review rhythm | Monthly or quarterly | Daily, hourly or live |
| Typical users | Executives, board, program leads | Supervisors, team leads, analysts |
| Number of measures | Roughly 15 to 25 | As many as the process needs |
| Example | Customer retention against a three year target | Open support tickets this hour |
One useful comparison, from BSC Designer, is that a dashboard works like a car’s instrument panel and a scorecard works like a GPS. The panel tells you how the car is running. The GPS tells you whether you are getting to the destination.
The line is not rigid. Teams at Xenia note a gray area where strategic dashboards borrow from both, pulling a short list of key measures into one view. Wayne Eckerson makes a related point in Performance Dashboards: sorting dashboards into operational, tactical and strategic is imperfect, but it helps organizations decide which performance system fits their needs.
In practice, the scorecard sits on top. Each strategic KPI should link down to an operational view where someone can see why it moved.
The four perspectives and the KPIs that fit
The KPI lists below start from the HBS Online description of each perspective. Treat them as a menu, not a checklist. You will use a few from each.
Financial
HBS Online lists sales revenue, operating expenses, net income and investment in assets as financial measures. Common choices include revenue growth, profit margin and return on invested capital.
For finance teams, this section often links to a close or statement view. Our guide to a month-end close dashboard shows how to build that drill-down.
Customer
This perspective covers quality, delivery speed and service experience, according to HBS Online. Typical KPIs are Net Promoter Score, customer satisfaction, retention rate and on-time delivery.
Internal process
HBS Online groups internal processes into operations, customer management, innovation, regulatory and social processes. Cycle time, defect rate, order accuracy and first-contact resolution are common examples. If your operations team already tracks these, reuse their definitions rather than writing new ones. For order handling in particular, this piece on order processing KPIs shows how dwell time and similar measures are framed.
Learning and growth
This is the perspective teams skip, and it is the one that explains the others. HBS Online splits it into three groups:
- Human capital: people, talent and knowledge.
- Information capital: databases, networks and technology.
- Organizational capital: leadership capability and cultural alignment.
Useful KPIs include employee engagement, training hours per employee, and the share of staff who use the new reporting tools.
Choose fewer KPIs, and choose them for a reason
A scorecard with 60 measures is a report, not a scorecard. The test for each candidate is whether leaders have a strategic reason to expect it to influence the goal. If nobody can explain the link, leave it off.
The Balanced Scorecard Institute says good KPIs are tied to objectives, objective, time bound, results focused and widely understood. That last point matters for dashboards. If two departments define “active customer” differently, the scorecard will start arguments instead of ending them.
For a broader look at translating objectives into measures and assigning ownership, this overview of business performance metrics is a useful companion.
A simple selection routine
- Write three to five strategic objectives in plain language.
- For each objective, list candidate measures.
- Cut any measure that has no clear link to the objective.
- Check that the data exists and can be refreshed on a schedule.
- Write a one sentence definition for each KPI, including the formula and the source system.
Step four removes more KPIs than people expect. A measure you cannot refresh reliably will go stale and erode trust in the rest.
Targets, owners and cadence
A KPI without a target is a number. A KPI without an owner is nobody’s job. Microsoft’s guidance on KPI dashboards gives the same sequence we use with clients: start with clear objectives, choose KPIs that reflect them, assign an owner and a tracking frequency, set targets that are ambitious but achievable, and set a regular reporting cadence.
A few practical rules:
- One owner per KPI. A team can contribute, but one person answers questions.
- Targets plus thresholds. A target says where you want to be. A threshold says when to act, for example red below 90% of target.
- Match cadence to the data. Monthly reporting for a metric that only changes annually adds noise.
- Attach initiatives. Link the projects meant to move a measure, so the review covers actions as well as results.
Tie the review to a meeting that already exists, such as the monthly leadership meeting or a board report. A scorecard that needs its own meeting rarely survives a year.
Examples by organization type
Public sector and government agencies
The profit logic of the original framework does not fit an agency. The Balanced Scorecard Institute suggests reframing the perspectives: financial becomes stewardship or budget accountability, customer becomes customers and stakeholders, and learning and growth becomes organizational capacity, covering people, culture, technology and capabilities. For government, stakeholder outcomes sit at the end of the value chain, not profit.
A sample agency layout:
| Perspective | Example KPIs |
|---|---|
| Stewardship | Budget variance, cost per case processed, audit findings closed |
| Stakeholders | Average wait time, satisfaction score, share of requests resolved on first contact |
| Internal process | Processing cycle time, backlog age, error rate |
| Organizational capacity | Vacancy rate, training completion, systems modernized |
The U.S. Government Accountability Office has long argued for this kind of balance. Its executive guide on measuring performance says reports should connect enterprise, program, project and individual objectives, and that balanced measures keep managers from optimizing one goal at the expense of the wider mission.
Healthcare
Hospital and clinic scorecards often put patient outcomes and safety in the customer perspective, and staffing and throughput in internal process. Our healthcare KPI dashboard playbook covers the measures in more detail.
Education
Schools can use student outcomes as the stakeholder perspective, with attendance, achievement growth and graduation rates. See our notes on student performance dashboard metrics.
Software and e-commerce
A product company might track recurring revenue and margin, retention and support satisfaction, release cycle time, and engineer training and turnover. We built a KPI progress overview dashboard for a SaaS team and an e-commerce KPI dashboard that show how targets and trends sit side by side.
For more layouts, see our executive dashboard examples.
Design rules for the dashboard itself
The layout carries as much weight as the KPI list. Effective scorecards, as Context Aware Analytics puts it, show all four perspectives in one view, compare current performance with targets and allow drill down into the factors behind a result.
We apply these rules:
- One page for the executive view. Four quadrants or four rows, one per perspective.
- Status first, detail second. Show actual, target, variance and a status color. Put trend lines next to each.
- Do not rely on color alone. Add an icon or a label for readers with color blindness.
- Show the data date. Leaders should see when each KPI last refreshed.
- Link down. Each KPI opens an operational page with filters and detail.
- Document definitions. A hidden tooltip or a definitions page keeps debates short.
There is also a step beyond display. Test the logic of your strategy with the data. If you believe training improves process quality, check whether the two measures actually move together over time. This is the “balanced” part working as intended.
Building a scorecard in Power BI
Power BI has a built in scorecard feature. According to Microsoft’s documentation, in Power BI Service you select New scorecard, then create goals with owners, current values and targets. Values can be typed in manually or connected to visuals in an existing report. You also set a status and, if you want, dates and a tracking cycle.
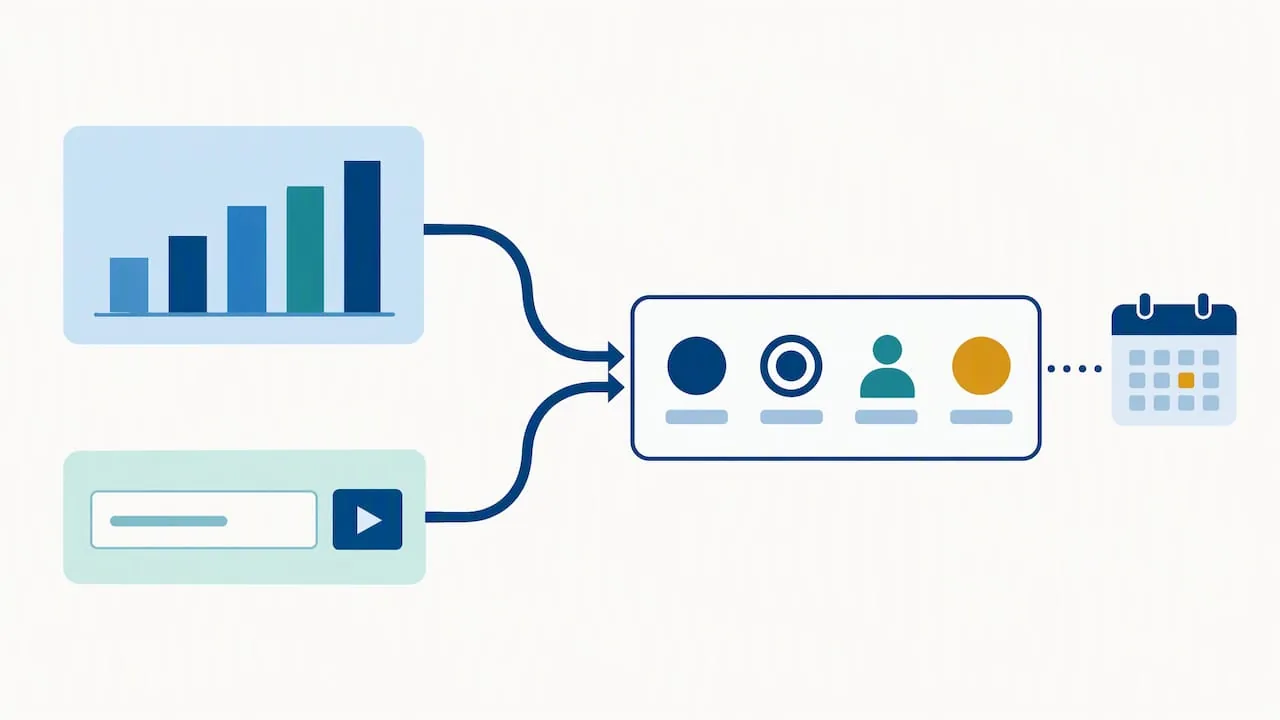
Another practical detail: goal notifications can reach Microsoft Teams when someone is assigned a goal, when a rule updates it, or when a person is mentioned in a check in note. That keeps owners in the loop without a separate email process.
A workable build sequence:
- Create the scorecard and add one goal per KPI.
- Assign an owner and a target to each.
- Connect goals to report visuals where the data is already modeled. Use manual entry only for measures with no source, such as a quarterly survey.
- Set status rules so color changes follow thresholds, not opinion.
- Share the scorecard with the leadership group and set the review cycle.
For an example of a Power BI dashboard with metrics and stable links, see this Power BI dashboard walkthrough.
The scorecard feature is a good start for goal tracking. When you need custom layouts, calculated variances or several data sources at once, a purpose built report with DAX measures is the better route. Tableau suits the same job when your leaders want more control over layout and drill paths. Our Tableau executive dashboard templates show what that looks like.
Where scorecard projects go wrong
- Too many KPIs. The page becomes a wall of numbers and nobody reads it.
- Manual updates. If owners must type values in every month, some will not. Automate refreshes wherever a source system exists.
- Unclear definitions. Two versions of one number end the scorecard’s credibility.
- No link to decisions. If a red status triggers no action, people stop looking at it.
- Financial bias. Teams add three customer KPIs and 20 financial ones, and the balance is gone.
Most of these are data problems. A scorecard is only as reliable as the pipelines, the models and the definitions underneath it.
Our perspective
We build dashboards in Tableau and Power BI, and we start with SQL. In scorecard projects, the visual design takes a small share of the effort. The harder work is agreeing on what “revenue,” “on time” or “active” means, then building a data flow that calculates it the same way every time.
So we recommend a plain order of work. Settle the objectives. Cut the KPI list until each measure earns its place. Write the definitions. Fix the pipeline. Only then draw the dashboard. Teams that reverse this order end up with attractive pages that finance, operations and the board each read differently.
We also suggest starting smaller than the framework implies. Ten well defined KPIs that refresh automatically beat thirty that depend on spreadsheets. You can add measures later, once leaders trust what they see.
— Frederick
Get help building yours
If you want a scorecard that leaders trust, we can help with the whole chain: KPI definitions, data modeling, SQL pipelines and the dashboard. Our BI and dashboard development service covers Tableau and Power BI, and our data strategy and governance work helps when the KPI definitions themselves are in dispute. We are registered for government work on SAM.gov and build reporting for public-sector teams.
See past case studies or book a free assessment through our site.
FAQ
Is a balanced scorecard a dashboard?
Not exactly. The balanced scorecard is a strategy framework, and a dashboard is one way to present it. A scorecard dashboard shows strategic KPIs by perspective with targets and status, usually reviewed monthly or quarterly.
How many KPIs should a balanced scorecard dashboard have?
There is no fixed number, but fewer is better. Many teams settle on three to six per perspective, and every measure should have a reason to influence a strategic objective. If you cannot name the owner and the target, remove it.
Can I build a balanced scorecard in Power BI?
Yes. Power BI Service includes scorecards where you create goals with owners, values, targets and statuses, and connect them to report visuals. For more complex layouts, a custom report with DAX measures gives you more control.
Does the balanced scorecard work for government agencies?
Yes, with adjusted perspectives. Agencies commonly use stewardship in place of financial, stakeholders in place of customers, and organizational capacity in place of learning and growth. Stakeholder outcomes become the main result, not profit.
Sources
- What Is a Balanced Scorecard? HBS Online
- Balanced Scorecard vs. Dashboard, BSC Designer
- Balanced Scorecards and Operational Dashboards, Xenia
- Types of Performance Dashboards, O’Reilly
- The Four Perspectives of the Balanced Scorecard, Balanced Scorecard Institute
- What Is a KPI Dashboard, Microsoft Power BI
- Executive Guide: Measuring Performance, U.S. GAO
- Balanced Scorecard Analytics, Context Aware Analytics
- Create scorecards and manual goals, Microsoft Learn
- Power BI notifications in Microsoft Teams, Microsoft Learn