
Finance data governance is the set of decisions, owners, rules and controls that determine how financial data is defined, accessed, protected, changed and used for reporting. It answers plain questions. Who owns the revenue number? Which definition of “customer” counts? Who can change a cost center? Who signs off when a figure is wrong? This guide covers what a working program contains, how it differs from data management, how master data fits in, and where to start. It also covers banking and healthcare, since readers often ask about both.
TL;DR
- Governance decides what should happen to financial data and who is accountable. Data management carries those decisions out.
- A usable framework names data owners, sets quality standards, controls access, tracks lineage and defines how data is retired.
- Master data, such as the chart of accounts, cost centers, customers and vendors, is where most finance governance problems start.
- Start small: pick the reports leadership relies on most, assign an owner to each number, and fix the data behind them first.
- Healthcare teams add privacy duties on top, because patient data falls under HIPAA.
Turn your data into decisions
We build Tableau and Power BI dashboards and the data models behind them. Book a free 30-minute analytics assessment and we'll map the fastest path for your team.
Book a Free Analytics AssessmentOn this page
- What finance data governance means
- Governance versus data management
- What belongs in a finance governance framework
- Master data: the hub under the numbers
- Banking data governance
- Healthcare data governance
- How to start without a two year program
- Our perspective
- Where Pniel Analytics fits
- FAQ
- Sources
What finance data governance means
The U.S. Government Accountability Office describes a data governance framework as the authorities, roles, responsibilities, structures, processes, policies, standards and resources used to define, steward, produce, secure and use data. That description comes from GAO’s review of federal agency data governance. Finance data governance applies the same idea to one domain: ledgers, budgets, forecasts, customer balances, vendor records and the reports built from them.
In practice, it is a short list of agreements:
- Every key figure has one written definition.
- Every definition has a named owner.
- Every source system has rules for who can change data and how changes are approved.
- Every report can be traced back to where its numbers came from.
Without these agreements, two people open two dashboards and see two different revenue totals. Then the meeting becomes an argument about numbers instead of a decision.
Governance versus data management
These two terms get mixed up, and the mix-up causes real gaps. A GAO report on financial regulatory reporting data draws the line clearly. Governance is the framework of decision rights, ownership, policies, standards and accountability. Management is the practical work across the data lifecycle: collecting, storing, integrating, validating, securing, maintaining, retrieving, archiving and disposing of data.
The Federal Housing Finance Agency uses similar language. Its 2016 advisory bulletin on data management describes data management as developing, implementing and enforcing policies, procedures and standards for how data are defined, shared, stored, protected, retrieved and purged.
A simple way to hold the difference:
| Data governance | Data management | |
|---|---|---|
| Core question | Who decides, and who is accountable? | How is the work done? |
| Typical output | Policies, definitions, ownership, standards | Pipelines, validation checks, storage, archives |
| Owned by | Finance leaders, data owners, a governance group | Data engineers, analysts, system administrators |
| Failure looks like | Nobody knows which number is right | Right number is defined but arrives late or broken |
You need both. A policy no one enforces is a document. A pipeline with no owner drifts.
What belongs in a finance governance framework
Sources describe the pieces in slightly different words, but they agree on the core. Financial Executives International says finance data governance should cover ownership, access controls, quality standards, privacy and security, lifecycle management, retention, disposal and regulatory compliance. Here is what each looks like on the ground.
Ownership and definitions
Start with a business glossary. List the 20 to 40 terms leadership uses most: revenue, bookings, net margin, days sales outstanding, headcount, active customer. Write one definition for each and name one owner. The owner is a business person, not an IT ticket queue.
Data quality standards
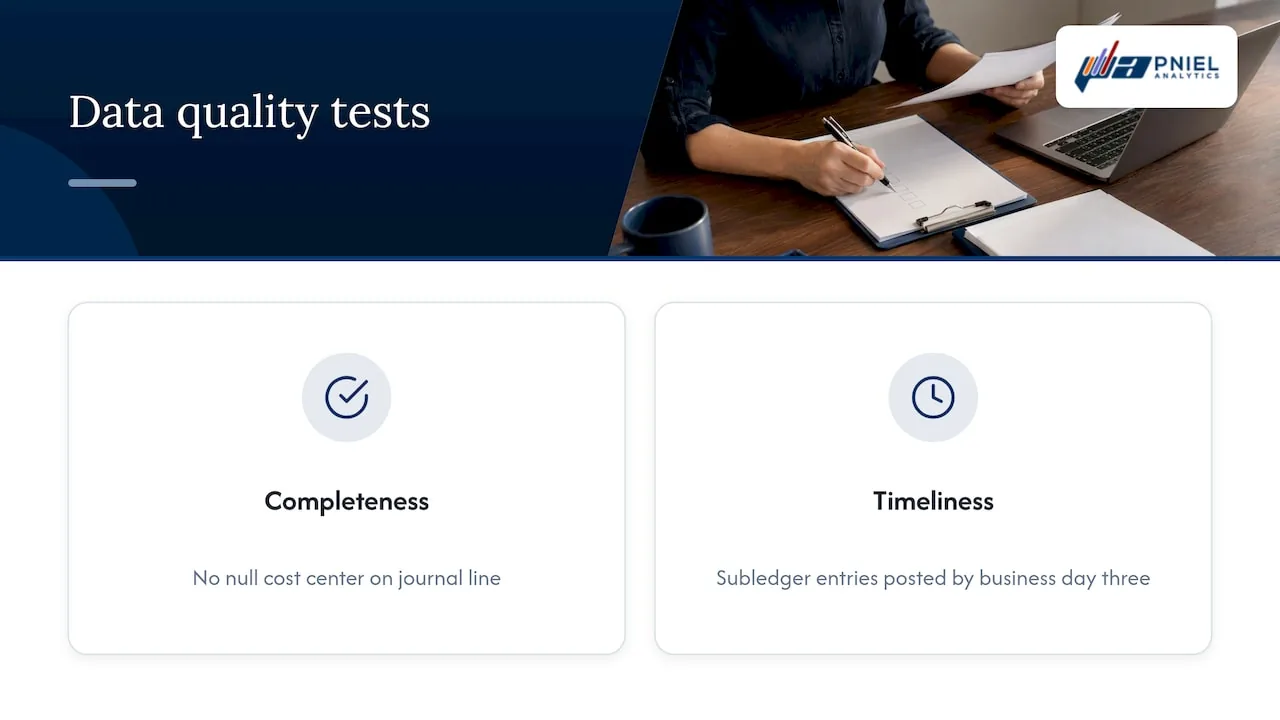
The FHFA expects data used for decision making to be relevant, accurate, complete, timely and consistent. Those five words make a good checklist for any finance team. For each key dataset, decide what “complete” and “timely” mean in numbers. For example: all subledger entries posted by business day three, or no null cost center on any journal line. Then test for it automatically. Our data quality management guide goes deeper on how to set those tests.
Access and security
The FFIEC IT Examination Handbook tells bank management to document data types, owners and purpose, to implement access controls, and to define processes for destroying data that is no longer in use. See its section on data analytics and governance. The same handbook notes that analytics reports may expose sensitive information, so confidentiality, integrity and availability should be built in when analytics tools are designed. For a finance team, that means role based access on dashboards, row level security where it applies, and a clear rule for who can export data.
Lineage and traceability
Lineage means you can follow a number from the report back through each transformation to the source system. Auditors and regulators ask for it. So do executives, in a simpler form: “Where does this come from?” Tools exist for this. Oracle’s documentation for its regulatory reporting governance product describes mapping multiple data sources to a standard business glossary and tracking data elements from source to use. You can get much of the value without a large platform if your pipelines are documented and your SQL is version controlled. For teams that work from public filings, resources on public financial data sources show how traceable, definition-aware sourcing works from the outside.
Lifecycle, retention and disposal
Decide how long each type of financial record is kept, where it is archived and how it is destroyed. Retention periods often come from regulation or your auditors, so confirm them with counsel or compliance rather than guessing.
Reporting controls
This is where governance meets the dashboard. Every executive report should have a listed source, an owner, a refresh schedule and a reconciliation step against the general ledger. The FFIEC also warns that people using analytics need enough knowledge to interpret dashboards, because incomplete data or weak reporting can lead to misuse in decisions. Training the readers matters as much as building the report. Our piece on how to tell if dashboard data can be trusted lists the checks a reader can run.
Master data: the hub under the numbers
Master data is the set of reference records that every transaction points to: the chart of accounts, cost centers, customers, vendors, products. Master data management (MDM) is the practice of keeping those records consistent across systems. Keboola’s glossary describes MDM as one component of financial data management that governs these reference entities.
People sometimes ask how MDM differs from data governance. Governance sets the rules and accountability. MDM applies those rules to a specific class of data. A master data hub is the system, or the agreed process, where the single approved version of each record lives and from which other systems read.
Why it matters for finance: when one vendor appears under three names, spend reports undercount it. When two business units define a cost center differently, consolidation takes manual work every month close.
Two examples show the range:
- Nationwide Insurance. A CIO case study from 2007 reports that a finance and IT governance group standardized differing business unit definitions and kept the rules of the master data system. That produced consistent compilation, analysis and reporting of financial data.
- SITA. In FEI’s 2015 CFO research, SITA’s CFO named poor data governance as a key reason ERP implementations fail. The company’s finance systems effort cut its chart of accounts from 8,500 accounts to 500 and cleaned its master data.
Master data errors often enter through manual entry and inbound documents. If orders and invoices arrive by email, guidance on how to cut email data mapping errors shows patterns for keeping those records clean before they reach the ERP.
Banking data governance
Banks carry more governance obligations than most finance teams, and examiners read the evidence. Three U.S. sources are worth knowing.
- FFIEC IT Examination Handbook. Its data governance and analytics material, cited above, sets expectations for documented data, access controls and secure disposal.
- FHFA advisory bulletin. It sets expectations on data management and data quality for institutions the agency oversees.
- Federal Reserve SR 11-7. This supervisory guidance on model risk says business units are generally responsible for the model risk tied to their strategies, and that model owners are ultimately accountable for model use and performance. It also calls for policies that define activities, procedures, resources and ways to evaluate compliance. Models are only as good as the data fed to them, so the same ownership logic applies to input data.
Roles tend to settle into a familiar shape:
| Role | What the person does |
|---|---|
| Executive sponsor | Backs the program, resolves disputes, reports to the board or risk committee |
| Data owner | Accountable for a data domain, such as loans, deposits or general ledger |
| Data steward | Maintains definitions, monitors quality, handles issues day to day |
| Data custodian | Runs the systems and applies access and retention rules |
| Governance council | Finance, risk, compliance and IT meet to approve standards and settle conflicts |
FEI’s finance and technology executives argue that finance must take an active part in governance, since reliable reporting, budgeting, forecasting, compliance and decisions all depend on consistent data. If governance lives only in IT, definitions drift from how the business uses them.
Healthcare data governance
Healthcare finance teams and operations leaders tracking patient outcomes face the same basics plus a privacy layer. The National Committee on Vital and Health Statistics defines health data stewardship as a responsibility to ensure purposeful and appropriate use of data derived from personal health information. Its principles include accountability, transparency, data integrity and quality, security safeguards and oversight of data uses. Both appear in its report to Congress.
On the legal side, the HIPAA Privacy Rule applies to covered entities such as healthcare providers and prohibits unauthorized disclosure of protected health information, as summarized in an HHS research document. For analytics, that raises concrete questions:
- Does the dashboard need patient level detail, or will aggregated counts do?
- Who can see identifiable records, and is that access logged?
- Are extracts to spreadsheets blocked or controlled?
We cover the technical side in nine steps for HIPAA compliant analytics. For privacy and compliance decisions specific to your organization, involve your privacy officer and counsel. You can also see how this plays out in our patient assessment analytics dashboard case study.
How to start without a two year program
Big governance programs stall because they try to cover everything. A narrower path works better.
- Pick five to ten reports that leaders use to decide. Board packs, monthly close summaries, cash forecasts, program performance reports.
- List every number on them. Write its definition, source system and current owner. Gaps show up fast.
- Assign owners. One person per number, with authority to settle disputes.
- Reconcile. Compare each report to the ledger or system of record. Log every difference and its cause.
- Fix the data upstream. Correct the SQL logic, mapping tables and master records. Repainting the dashboard does not fix a bad join.
- Automate checks. Row counts, null tests, totals that must match, freshness alerts.
- Set a review rhythm. A monthly governance meeting of 45 minutes is enough to keep definitions current.
- Widen the scope. Add the next set of reports.
FEI reported in 2020 that organizations seeking a single version of the truth were unifying actuals, budgets and forecasts, and in some cases bringing CRM, HCM, ERP and other operational data together with financial data. That is a sensible second phase, not a first one. Get the core numbers stable before you integrate more systems.
AI adds one more reason to act. Keboola notes that AI in finance can give confidently wrong answers when governed data is not used properly, which makes lineage and governance necessary for checking outputs against sources. If you plan to put AI tools on top of finance data, clean definitions come first.
Our perspective
We build dashboards in Tableau and Power BI, and we see the same pattern in most engagements. A leader says the dashboard looks wrong. The cause is rarely the chart. It is a join that duplicates rows, a definition two teams read differently, or a source that refreshes late.
That is why we treat SQL as our core skill. Governance on paper does not help if the pipeline underneath produces a different number each run. We start by finding where the data breaks, then agree on definitions with the people who own them, then build the dashboard on top. The order matters.
We also keep governance light at the start. A glossary, named owners, a few automated tests and a monthly review will do more than a large framework nobody reads. Teams can grow it as trust grows.
— Frederick
Where Pniel Analytics fits
If your finance or public sector team needs reporting leaders can rely on, our data strategy and governance service covers definitions, ownership and the data flows behind your reports. We then build the executive views in Tableau or Power BI. Government teams can see our public sector work. To talk through your situation, start at pnielanalytics.com and book a free assessment.
FAQ
What is the difference between MDM and data governance?
Data governance sets the policies, ownership and accountability for data. Master data management applies those rules to shared reference data such as accounts, cost centers, customers and vendors. Governance is the broader program, and MDM is one of the practices inside it.
Who should own finance data governance?
Finance should own the definitions and quality standards for financial data, with IT and security running the systems and controls. An executive sponsor, often the CFO or a controller, backs the program. A small council from finance, risk, compliance and IT settles disputes.
What should a finance governance framework include?
At minimum: a business glossary, named data owners, quality standards, access controls, lineage, retention and disposal rules, and reporting controls. Banks should also check the FFIEC handbook and any guidance from their own regulator.
Do small teams need data governance?
Yes, in a lighter form. If more than one person produces or reads financial reports, you need shared definitions and a named owner for each key number. A one page glossary and a monthly check can be enough to start.
Sources
- GAO, Regulatory Reporting Reform: Financial Data (GAO-26-108420)
- GAO, Data Governance: Agencies (GAO-21-152)
- FHFA, Data Management and Usage Advisory Bulletin
- FFIEC IT Examination Handbook, Data Analytics
- Financial Executives International, Embracing Data Governance in Finance
- Oracle, Data Governance for US Regulatory Reporting user guide
- Keboola, What Is Financial Data Management?
- CIO, How Master Data Management Unified Financial Reporting at Nationwide Insurance
- FEI, CFOs in the Digital Age
- Federal Reserve, SR 11-7 Supervisory Guidance on Model Risk Management
- NCVHS, 12th Report to Congress
- HHS ASPE, Legal and Ethical Framework
- Public financial data sources guide
- Email data mapping errors guide