
An anomaly detection dashboard shows you which numbers moved in a way they normally do not, and helps you find out why. It marks the unusual point, shows the range you expected, and lets you click through to the cause. In Power BI you can switch this on for a line chart in a few clicks. In Tableau, alerting on unusual metric changes runs through Tableau Pulse. Either way, the tool is the easy part. The hard part is clean data, sensible sensitivity and a clear owner for every alert.
This guide covers what these dashboards do, how each tool handles anomalies, the limits you should know before you commit, and how to keep alerts useful instead of noisy.
TL;DR
- An anomaly detection dashboard flags values outside an expected range, then helps you investigate the cause.
- Power BI adds anomalies to a time-series line chart from the Analytics pane. Tableau Pulse sends alerts on followed metrics.
- Too many alerts is the most common failure. Tune sensitivity, require persistence and account for seasonality.
- Bad source data produces bad alerts. Fix the SQL and the data flow before you tune the visuals.
- Every alert needs an owner and a next step, or the dashboard turns into decoration.
Turn your data into decisions
We build Tableau and Power BI dashboards and the data models behind them. Book a free 30-minute analytics assessment and we'll map the fastest path for your team.
Book a Free Analytics AssessmentOn this page
- What an anomaly detection dashboard is
- The three kinds of anomalies
- Anomaly detection in Power BI
- Anomaly detection in Tableau
- Design the dashboard for investigation
- Cut false alerts before they cut your credibility
- Connect alerts to a response
- Our perspective
- Get help building yours
- FAQ
- Sources
What an anomaly detection dashboard is
A normal dashboard shows you what happened. An anomaly detection dashboard also tells you what looks wrong. It compares each new value with what past data says to expect, and it marks the values that fall outside that range.
Most of these dashboards have four parts:
- A baseline. The expected value for each period, based on history.
- A boundary. An upper and lower limit around the baseline.
- A marker. A visible flag on any point outside the boundary.
- A way to investigate. Drill-downs, filters or an explanation panel that points to likely causes.
What an anomaly alert is
An anomaly alert is a message sent when a metric leaves its expected range. It can arrive by email, Slack or mobile notification, so nobody has to open the dashboard to notice a problem. A good alert names the metric, shows how far it moved and links to the view where someone can look into it.
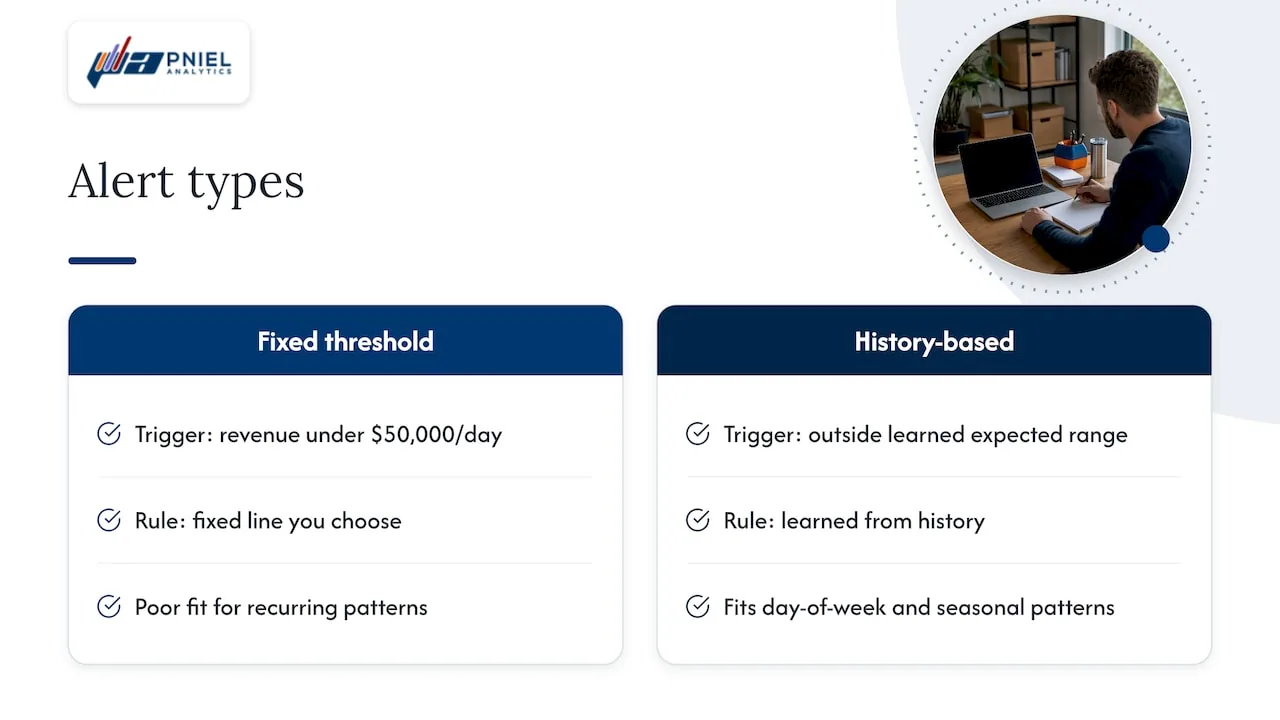
The difference between a threshold alert and an anomaly alert matters. A threshold alert fires when a number crosses a fixed line you chose, such as revenue under $50,000 a day. An anomaly alert fires when a number crosses a line the system learned from history. That second kind handles metrics that rise and fall with the day of the week or the season. Monitoring platform documentation makes the same point: anomaly detection suits metrics with trends and recurring time-of-day or day-of-week patterns that fixed thresholds handle poorly.
The three kinds of anomalies
Before you configure anything, know what you are hunting. Researchers who study time series group anomalies into point, contextual and collective types. IBM’s overview describes the same three in plain terms.
| Type | What it means | Example |
|---|---|---|
| Point | One observation sits far from the rest | A single day of invoices three times the usual volume |
| Contextual | A value is normal in general but abnormal for its context, such as time or location | High heating costs in July |
| Collective | A group of observations is abnormal together, even if each one looks fine alone | Daily orders that stay slightly low for two weeks |
The type tells you what to build. Point anomalies suit simple range markers. Contextual anomalies need a baseline that understands the calendar. Collective anomalies need a method that looks at sequences, which basic markers often miss. If your real worry is a slow leak in margin or enrollment, a point-based flag will not catch it.
Anomaly detection in Power BI
Power BI has built-in anomaly detection for line charts. Microsoft says the feature automatically enhances time-series line charts by identifying values outside an expected range and offering explanations for root-cause analysis.
How to turn it on
- Build a line chart and put a date or time field on the Axis.
- Add your measure to the Values well.
- Open the Analytics pane.
- Find Anomalies and turn it on.
Power BI then plots markers on the unusual points and draws the expected range. According to the Analytics pane documentation, that range can appear as a shaded fill or as upper and lower boundary lines.
Sensitivity
Sensitivity decides how picky the detector is. Microsoft explains that higher sensitivity flags more deviations, while lower sensitivity flags only larger ones. Start in the middle. Look at a year of history. If you see markers on days everybody already knew were odd, lower it. If a real incident slipped through, raise it.
Explanations
When you select a marker, Power BI can offer natural-language explanations and list factors tied to that anomaly, ranked by how strongly they explain it. Treat these as leads, not verdicts. They point your analyst at the right column. They do not replace someone who knows the business.
Limits to know first
The same Microsoft tutorial lists the main constraints:
- The visual must be a line chart with a time field.
- You need at least four data points.
- Legends and multiple values on the chart are not supported.
- Certain connection types and report scenarios are not supported, so check the current list before you design around it.
Report Insights, a separate feature
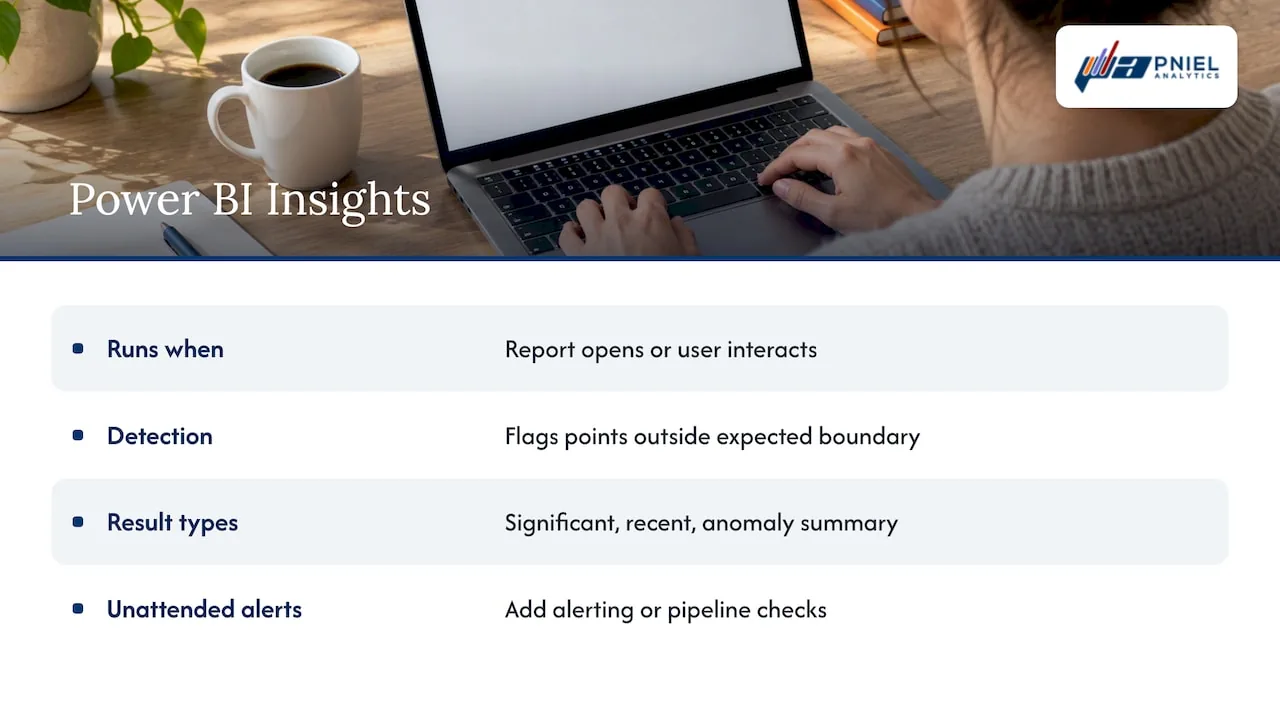
Power BI also has an Insights feature that scans a report. It finds abnormal spikes or dips by computing a boundary around expected values and marking points outside it. Microsoft describes three result types: significant anomaly, recent anomaly and anomaly summary. These insights are computed when a user opens the report or interacts with it, for example by changing pages, applying filters or cross-filtering. So they reflect what that person is looking at right now, not a scheduled overnight scan.
That last point matters for planning. If you need someone to be told about a problem when nobody is looking at the report, you will need alerting or a data pipeline check on top. Our guide to Power BI incremental refresh covers how to keep the underlying data fresh enough for alerts to mean something.
Anomaly detection in Tableau
Tableau handles this differently. The most direct route to anomaly alerts is Tableau Pulse. Pulse surfaces changes in metrics people follow. Tableau’s documentation says its insights can alert users to hidden changes or anomalies in metrics so they can diagnose issues sooner.
How Pulse alerts work
Pulse raises an alert in two cases, per Tableau’s alert documentation:
- A followed metric enters an unfavorable threshold range.
- A new unfavorable trend develops.
Alerts reach people through digests, email, Slack or mobile notifications. Trend detection needs a materially changed trend over at least three periods. It uses the metric’s sentiment, meaning whether up is good or bad, and it accounts for expected seasonal patterns.
Timing and repeats
Two behaviors affect how you plan around Pulse. First, it checks for alerts once every 24 hours, at the same time it builds email and Slack digests. That suits daily and weekly KPIs. It does not suit a metric where minutes count, such as a payment system outage. Second, a threshold alert fires when a metric first enters the unfavorable range and does not repeat while it stays there. It can fire again after the metric returns to a favorable range and crosses again.
Dashboards built in Tableau itself
Many teams also want anomaly markers inside a regular Tableau dashboard. The usual approach is to calculate the baseline and the boundary yourself, from a rolling average and a spread measure, then color the points that fall outside. This gives you full control. You decide the window, how to handle holidays and what counts as unusual. It also means the logic must be documented, because the next analyst has to understand it. Our Tableau consulting work often includes moving that logic into SQL, so that every dashboard uses the same definition of normal.
Design the dashboard for investigation
A dashboard that flags an anomaly and stops there leaves the reader with a question and no way to answer it. Design for the follow-up.
- Put the flagged chart at the top. Show the expected range in a muted color so the marker stands out.
- Put the next question next to it. If revenue dropped, show it by region, product and channel on the same page.
- Keep the same time grain. Do not mix daily and monthly views on one page.
- Label the units and the period. A reader should never guess whether a number is a count or a percentage.
- Limit the page to a few KPIs. Ten flagged metrics on one page means none of them get attention.
Good layout habits carry across subject areas. Looking at HR analytics dashboard templates is a quick way to see how other teams arrange trend views and comparisons.
For finance teams, the same thinking applies to variance reporting. Our walkthrough of a minimal Power BI dashboard for FP&A shows a layout that keeps the trend and the explanation close together.
Cut false alerts before they cut your credibility
The fastest way to kill an anomaly program is to send too many alerts. People learn to ignore them within weeks. Four habits prevent that.
Require persistence
One odd reading is often noise. A well-built alerting model predicts the next value, builds an acceptable variation zone and triggers only when real data leaves that zone for a set duration. That duration requirement is the part many dashboard builders skip. If your tool does not offer it, add it: alert on two or three consecutive periods, not one.
Respect seasonality
A retailer’s December and a school district’s August are not anomalies. Make sure your baseline sees at least a full cycle of history. Tableau Pulse builds expected seasonal patterns into trend detection, as noted above. If you build your own, include the calendar as a factor.
Do not use it on new metrics
Anomaly models learn from the past. Datadog’s documentation warns that applying them to a new metric can give poor results, because there is no history to predict from. For a new KPI, use a plain threshold for a few months first.
Fix the data first
Many “anomalies” are really broken loads: a missing file, a duplicated batch, a changed column. If the source data is unreliable, your dashboard will flag your pipeline, not your business. Check freshness, row counts and null rates before the data reaches the chart. Our article on dashboard automation explains how to build those checks into the refresh cycle.
A short test for any new alert: if it fired tomorrow, would someone know what to do? If not, do not turn it on yet.
Connect alerts to a response
An alert is the start of a process. Write down four things for each one:
- Owner. One named person or role, not a team inbox.
- First check. Is the data right? Rule out a pipeline problem before you chase a business cause.
- Escalation. Who gets told if it is real, and by when.
- Closure. How the result is recorded, so you can see later which alerts were useful.
Keep a simple log of every alert and its outcome: real issue, data error or expected event. After a month, you will see which alerts to remove and which thresholds to adjust. That log is also the best material for improving sensitivity settings.
For public-sector teams, this record often doubles as performance and program reporting evidence. A documented trail of what was flagged, who reviewed it and what changed is easy to defend in an audit or a budget hearing.
Our perspective
We build dashboards for a living, and most anomaly problems we see start below the dashboard. A team turns on anomaly detection, gets a screen full of flags, and concludes the feature does not work. In most cases the feature works. The data feeding it does not.
That is why we start with SQL. We trace each KPI back to its source, check how it is loaded and agree on one definition before we draw a chart. Then the anomaly logic has something solid to measure against. We also push for fewer alerts. Three alerts that people trust beat thirty that nobody reads.
Our advice for a first project: pick one KPI that leadership checks every week, build its baseline, run the alerts quietly for a month and review every flag with the person who owns the metric. Only then send alerts to a wider group.
— Frederick
Get help building yours
If you want anomaly detection on your KPIs without the noise, we can help. We design the data flow, the baseline logic and the dashboard together, in Tableau or Power BI. See our BI and dashboard development services, or start with a Power BI consulting conversation. Book a free assessment and we will review the metrics you most need to watch.
FAQ
What is an anomaly alert?
It is a notification sent when a metric moves outside its expected range. The range comes from historical patterns, not a fixed number. It usually arrives by email, Slack or mobile message.
Does Power BI have anomaly detection?
Yes. You can turn it on for a line chart with a time field from the Analytics pane. Power BI marks unusual points, shows an expected range and can explain a selected anomaly. It needs at least four data points and has some unsupported scenarios, so review Microsoft’s limits before you plan a report.
Can Tableau detect anomalies?
Tableau Pulse alerts users when a followed metric enters an unfavorable range or develops a new unfavorable trend. You can also build your own baseline and boundary calculations in a standard Tableau dashboard. Which route fits depends on whether you want managed alerts or full control of the logic.
How do I reduce false positives?
Require an anomaly to last more than one period, include seasonality in the baseline and avoid using it on brand new metrics. Check data quality first, since broken loads often look like business anomalies. Review each alert’s outcome monthly and remove the ones that never lead to action.
What is the difference between a point and a collective anomaly?
A point anomaly is a single value far from the rest. A collective anomaly is a group of values that look strange together, even if each one seems normal alone. A slow, steady decline is a typical collective case.
Sources
- Time-Series Anomaly Detection: Overview and New Trends (VLDB)
- What Is Anomaly Detection? (IBM)
- Anomaly Detection Tutorial for Power BI (Microsoft Learn)
- Use the Analytics pane in Power BI (Microsoft Learn)
- Find Insights in your reports (Microsoft Learn)
- Get Tableau Pulse Alerts (Tableau)
- The Insights Platform and Insight Types in Tableau Pulse (Tableau)
- Anomaly Monitor (Datadog documentation)
- Anomaly detection (New Relic documentation)