
Power BI can forecast with one click. Select a line chart with a date axis, open the Analytics pane, turn on Forecast, and the chart extends into the future with a shaded confidence band. The feature is quick and useful for simple trends. It also has firm limits, and a forecast you cannot check is a risk when leaders plan budgets from it. This guide shows you how to build the forecast, how to read it, how to test it, and when to use something stronger.
TL;DR
- Power BI’s built-in forecast works only on line charts with a date field on the X-axis and one value on the Y-axis.
- You control four things: forecast length, confidence interval, seasonality and how many recent points to ignore.
- Power BI gives no accuracy diagnostics. Test the forecast yourself by hindcasting: forecast a period you already know and compare.
- The built-in tool fits steady, regular data. Intermittent demand, several seasonal cycles or outside drivers call for R, Python or a modeling layer in your data.
- Forecast quality depends mostly on the data behind the chart, not on the visual.
Turn your data into decisions
We build Tableau and Power BI dashboards and the data models behind them. Book a free 30-minute analytics assessment and we'll map the fastest path for your team.
Book a Free Analytics AssessmentOn this page
- What Power BI forecasting does
- What your data needs before you start
- Build a forecast in Power BI Desktop, step by step
- The forecast settings, explained
- How to check whether the forecast is any good
- Where the built-in forecast falls short
- Forecasting demand and sales in practice
- Beyond the built-in line: predictive options in Power BI
- Our perspective
- Get help with forecasting in Power BI
- A short checklist before you share a forecast
- FAQ
- Sources
What Power BI forecasting does
The built-in forecast is a feature of the Analytics pane. Microsoft describes the pane as the place to add reference lines, error bars, forecasts and anomaly detection to a visual. You open it by selecting a visual and choosing the Analytics icon. The forecast option is available only for line charts.
Under the hood, Power BI applies exponential smoothing. This method gives recent observations more weight than older ones. It picks up level, trend and, when you set it, a repeating seasonal pattern. You do not choose the model or tune its parameters. That keeps the feature simple, and it is also the main reason it has limits.
The shaded band around the forecast line is the confidence interval. It is the range where the data will likely fall. A wider band means more uncertainty. Executives often read the center line as a promise. The band is the part that tells them how much to trust it.
What your data needs before you start
The feature is picky about setup. If one condition is missing, the forecast option is grayed out.
- A line chart. Other visuals do not offer the forecast.
- One date field on the X-axis and one value on the Y-axis. Microsoft’s training lab states this setup and notes that forecasting is unavailable without it.
- Even time intervals of at least one day. Microsoft’s documentation says the intervals must be the same between values. If your table has gaps, such as missing months, fix them first.
- Enough history. Microsoft’s lab recommends at least two cycles of data for an accurate and stable forecast. For monthly data with a yearly pattern, that means 24 months at the very least.
Two practical points save time. Use a continuous date axis rather than a text or categorical axis. And use a proper date table in your model, so every period exists even when no sales happened. Our guide to Power BI incremental refresh covers how to keep that history loading reliably as it grows.
Build a forecast in Power BI Desktop, step by step
- Create a line chart. Put your date field on the X-axis and one measure, such as revenue or order count, on the Y-axis.
- Select the chart and open the Analytics pane from the Visualizations area.
- Expand the Forecast section and turn Forecast on.
- Choose the time unit, such as months.
- Enter the forecast length, which is how far ahead you want to look.
- Set seasonality (explained below).
- Set the confidence interval.
- Select Apply.
Microsoft’s lab walks through this exact sequence. Its example uses months as the unit, a length of one month, seasonality of 365 and an 80% confidence interval. Treat those as sample values for a lab dataset, not as defaults to copy. If you want a structured way to practice these settings on your own data, a Power BI study plan can help you build the habit in a few weeks.
The forecast settings, explained
Forecast length
This is how many units ahead the line extends. Keep it short relative to your history. A common rule of thumb is to forecast no further ahead than a fraction of the data you have. Twelve months of forecast from 24 months of history is a stretch, and the confidence band will show it by fanning out.
Confidence interval
The interval sets how wide the shaded band is. One tutorial source lists a range of 75% to 99% for this setting. A higher percentage gives a wider band and a lower chance of the actual value falling outside it. For planning, a wider band is the honest choice. For a quick trend view, a narrower one reads more cleanly.
Seasonality
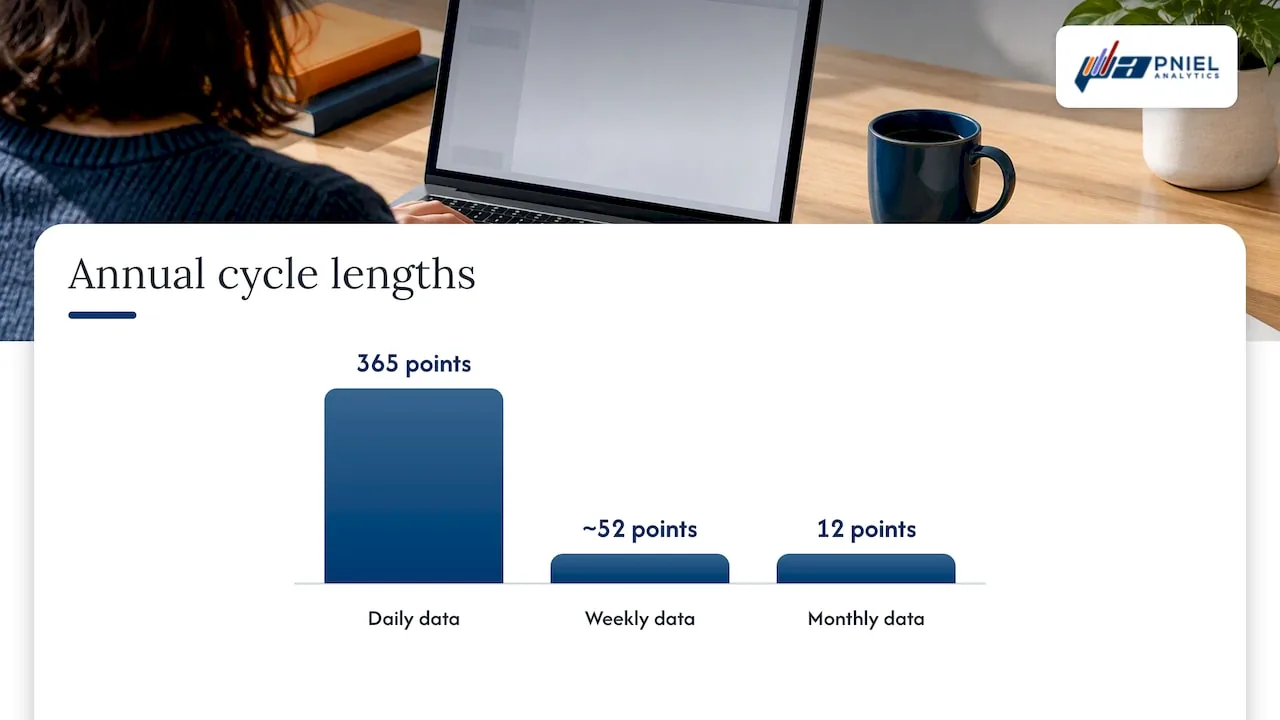
Seasonality tells Power BI how many data points make one repeating cycle. Microsoft’s lab says the value should match the known cycle in your data: its example mentions 365 for annual daily data, 7 for weekly patterns and about 30 for monthly patterns. If you leave seasonality on auto, Power BI tries to detect a pattern. If your data has no clear cycle, a wrong manual value can make the forecast worse than none at all.
The unit of your data matters here. With monthly points and a yearly cycle, the cycle length is 12 points. With weekly points it is about 52.
Ignore the last
This option drops the most recent points before fitting the model. It has two uses. First, you can exclude a partial period, like a month that is only half complete. Second, it is the easiest way to run a hindcast test, which we cover next.
How to check whether the forecast is any good
Power BI does not report error measures for the forecast line. There is no built-in score, so you need to test it yourself. The standard method is hindcasting: ask the model to predict a period where you already know the answer, then compare.
Here is a simple routine:
- Set “Ignore the last” to the number of recent periods you want to hold back, for example six months.
- Set the forecast length to the same number.
- Compare the forecast line with the actual values you held back.
- Calculate an error measure. Two common ones are RMSE (the typical size of the miss, in the units of your data) and MAPE (the average miss as a percentage of the actual).
- Repeat with a different hold out period. One lucky window proves little.
This approach is described by one practitioner who works with Power BI forecasting, who points out that the tool has no built-in diagnostics and suggests RMSE or MAPE on the hindcast values. For a wider view of how teams judge predictive models, this predictive analytics guide covers evaluation ideas that carry over to BI work.
A useful question for any forecast: does it beat a naive guess? If next month simply equals the same month last year and that guess has a lower error than the Power BI line, the model is not adding value.
Where the built-in forecast falls short
The feature suits a clean monthly or weekly series with a steady trend and one seasonal cycle. It struggles in these cases:
- Intermittent demand. Spare parts, project work or any series with many zero periods. The same practitioner advises against using the built-in forecast for this kind of data.
- Several seasonal cycles. Hourly or daily data with daily, weekly and yearly patterns at once. The built-in tool takes one seasonality value.
- Outside drivers. Price changes, promotions, weather or staffing levels that move the numbers. The model sees only the history of the one measure.
- Short history. A forum answer on Microsoft’s community site argues that a forecast built on fewer than 20 actual points is not meaningful. That is one user’s view, but it matches the two cycle guidance from Microsoft above.
- Missing data near the end of the series. Gaps in the latest periods pull the forecast off course. Fill or fix them before you trust the line.
The same practitioner suggests moving to methods such as TBATS, Prophet, SARIMAX or automated machine learning when you hit these cases. You do not need to memorize the names. The point is that these needs are separate modeling work, usually done in R, Python or a data platform, with the results loaded back into Power BI for display.
Forecasting demand and sales in practice
Demand and sales are the most common use. A finance team wants next quarter’s revenue range. An operations lead wants to see order volume before staffing a shift. Both can start with the built-in line.
A sound setup looks like this:
- Aggregate to a regular period, usually months. Daily data with weekday swings and holidays is noisy and hard to model with one seasonality value.
- Forecast one measure per chart, such as total revenue, rather than every product. Small items with sparse sales produce unstable lines.
- Show the confidence band. Never hide it to make a chart look tidier.
- Label the chart as a statistical projection, and state the history window used.
- Keep a plan or budget line on the same chart so readers can see the gap.
If you work in finance, our walkthrough on building a minimal Power BI dashboard for FP&A shows how to lay out actuals, budget and variance so a forecast line has context. More finance topics are collected in our finance analytics articles.
Beyond the built-in line: predictive options in Power BI
There are three levels of effort, and most teams move up only when they must.
| Level | What it is | Good for | Trade off |
|---|---|---|---|
| Built-in forecast | Analytics pane on a line chart | Steady monthly or weekly trends | One model, no diagnostics, limited control |
| R or Python in Power BI | Scripts that run in the report or in a data flow | Custom models, outside variables, backtesting | Needs coding skill and careful refresh setup |
| Data platform modeling | Models trained outside the report, scores stored in a table | Large volumes, many series, repeatable scoring | More build effort and governance |
The third path is the one Microsoft’s Fabric tutorial series follows. Its last part builds a Power BI report from saved predictions generated by batch scoring. The pattern is the same in any stack: the model runs upstream, writes predictions to a table, and Power BI reads that table like any other source. This keeps the report fast and the model testable.
Our perspective
Most forecast problems we see are data problems. A line chart with gaps in the date column, duplicate orders or a changed product code will forecast badly no matter which model sits behind it. We start by looking at the data flow: where the numbers come from, how often they load, and which transformations touch them. SQL work comes first, because a forecast is only as steady as its inputs.
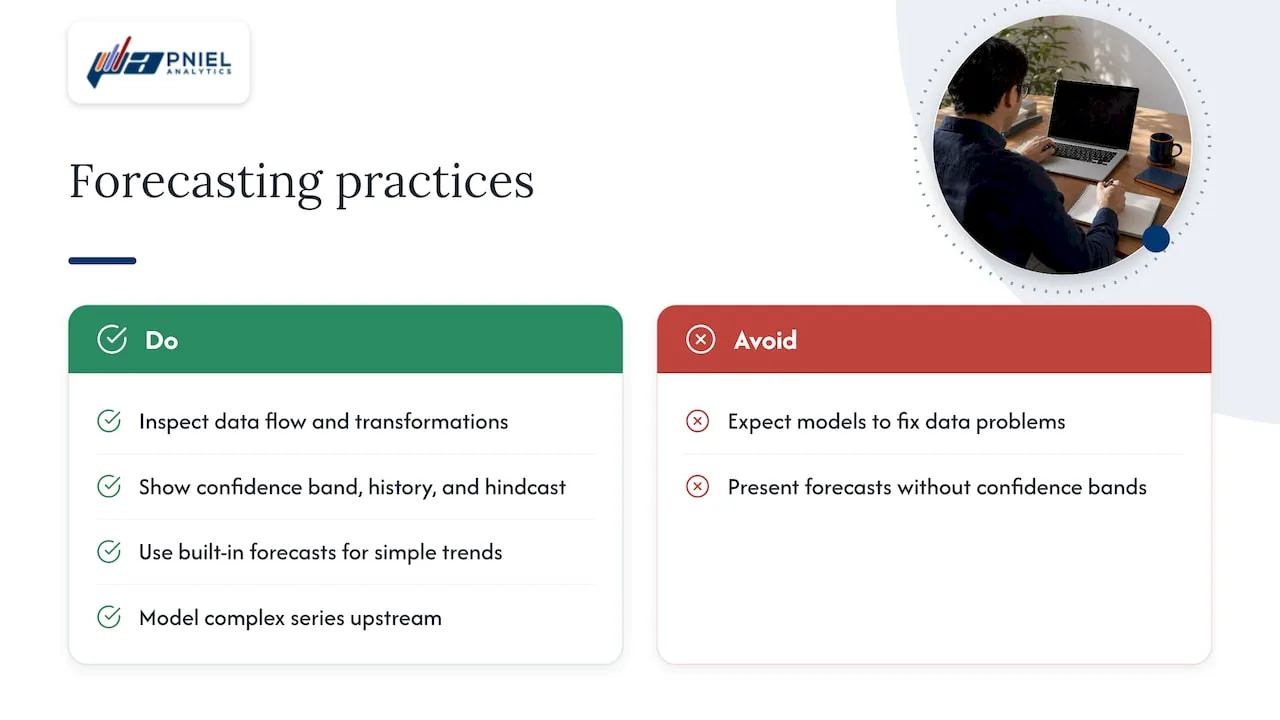
We also push for a plain rule: every forecast on an executive page shows its confidence band, the history it used and a hindcast result. Leaders can then decide how much weight to give it. A forecast that is wrong by 5% and says so is more useful than one that looks exact and misses by 20%.
For simple trends, the built-in feature is a good choice, and we use it. When the series is intermittent, seasonal in several ways or driven by outside factors, we model it upstream and send the results to the dashboard.
— Frederick
Get help with forecasting in Power BI
If your forecast line moves around, does not match what finance expects or sits on data nobody fully trusts, we can help. We build Power BI dashboards, the SQL pipelines behind them and, where the built-in tool is not enough, predictive models that feed your reports. Our Power BI consulting page describes how we work. For models beyond the Analytics pane, see our advanced and predictive analytics service.
We also work with public sector teams and are registered for government work on SAM.gov. To talk through your reporting needs, book a free assessment.
A short checklist before you share a forecast
- The date axis is continuous and has no missing periods.
- You have at least two full cycles of history, and more when seasonality is strong.
- Seasonality matches the real cycle in the data, or you have left it on auto.
- The latest period is complete, or you used “Ignore the last” to drop it.
- You ran at least one hindcast and recorded RMSE or MAPE.
- The chart shows the confidence band and states the history window.
- Someone on the team owns the data behind the chart and knows when it refreshes.
If your team is also deciding which BI tool should carry forecasts, our BI tools articles compare the options.
FAQ
Can I forecast in Power BI without writing DAX?
Yes. The built-in forecast needs no DAX. You add a line chart, open the Analytics pane and turn Forecast on. DAX only becomes useful if you want to build your own measures, such as a naive baseline or an error calculation for testing.
Why is the forecast option grayed out?
Usually the chart is not a line chart, or the X-axis does not hold a single date field, or the Y-axis holds more than one value. Microsoft’s training material lists the line chart with one date and one value as the required setup. Fix the fields and the option returns.
How much history do I need?
Microsoft’s lab recommends at least two cycles of data. For monthly data with a yearly pattern, that is 24 months. More history gives a steadier result, and some practitioners ask for three or four full cycles when seasonality matters.
How do I know if the forecast is accurate?
Power BI does not show an accuracy score. Hold back recent periods with “Ignore the last,” forecast them, then compare to the actual values using RMSE or MAPE. Repeat on more than one window before you rely on the result.
Sources
- Use the Analytics pane in Power BI, Microsoft Learn
- Perform analytics in Power BI, Microsoft Learning lab
- Forecasting in Power BI, DataCamp course
- Power BI Forecast step by step examples, ExcelMojo
- Time series forecasting in Power BI, Sandeep Pawar
- How to create a forecast in Power BI Desktop, Microsoft Fabric Community
- Tutorial Part 5: Visualize predictions with a Power BI report, Microsoft Learn
- Power BI study plan, AnyLearns
- Predictive analytics guide, PSC Group