TL;DR
- A clinic executive dashboard puts 8 to 10 operational and financial KPIs — patient volume, no-show rate, wait time, provider utilization, payer mix, revenue per visit, days in A/R and patient satisfaction — on one screen leaders can read in under a minute.
- Build it on your EHR, practice-management and billing data, keep it to one page, show a refresh time, and surface exceptions first so directors can act the same day.
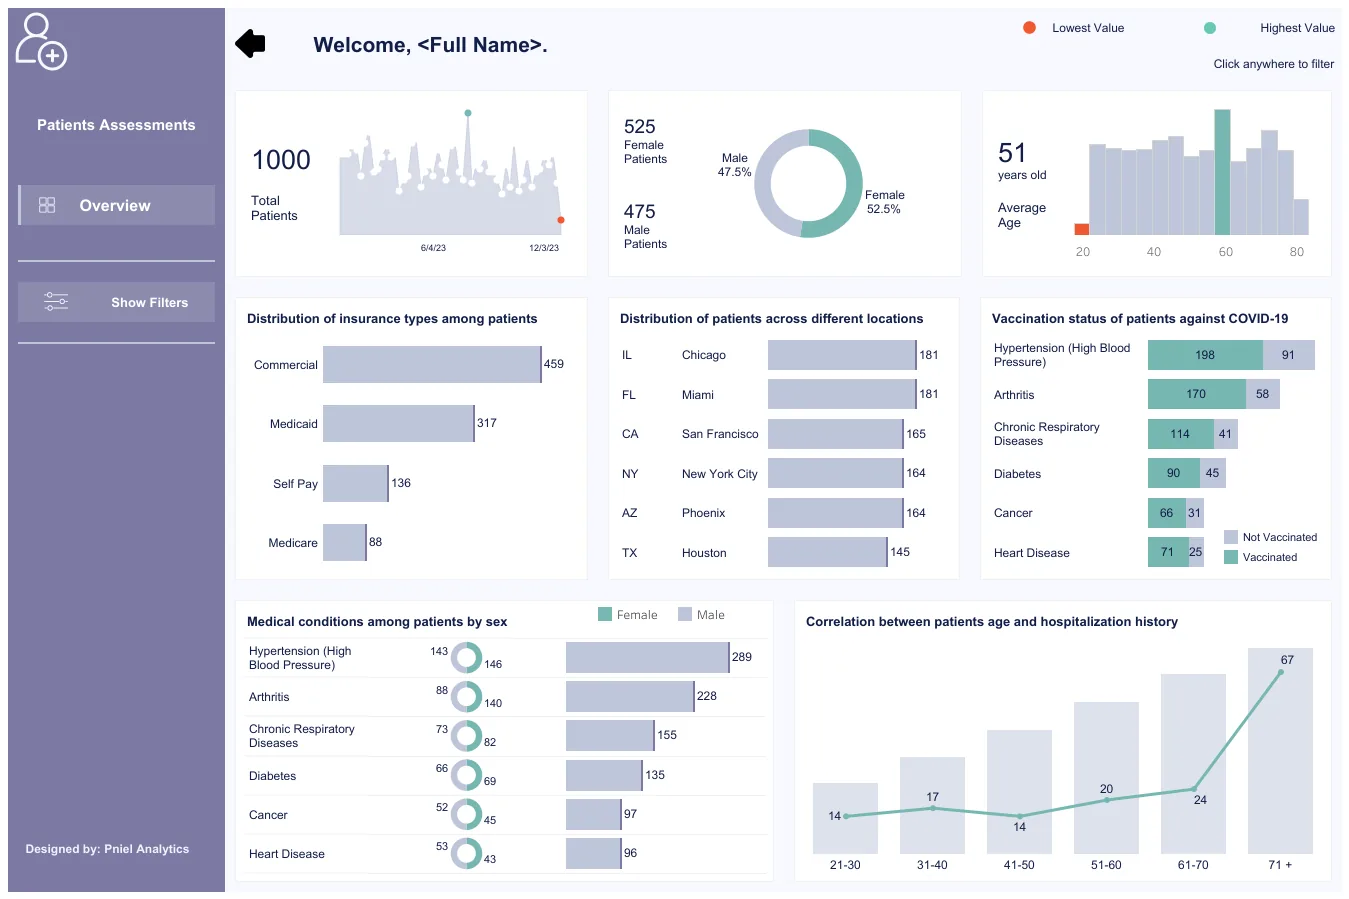
A clinic executive dashboard — sometimes called a healthcare executive dashboard or a clinic KPI dashboard — gives practice leaders one trusted view of how the clinic is actually running: how many patients are coming through, whether providers are booked efficiently, how long people wait, and whether the money side is healthy. This guide covers the KPIs worth tracking, a one-page layout, whether to build it in Tableau or Power BI, where the data comes from, and the pitfalls that quietly make these dashboards useless. Every figure described below uses sample data only — no real patient records and no client names.
For a wider set of layouts, see our executive dashboard examples, which includes a healthcare/clinic template, and the patient assessment analytics dashboard sample build. For the full KPI methodology, the healthcare KPI dashboard playbook goes deeper on definitions.
The 8 to 10 KPIs clinic leaders track
A good executive view answers one question per tile and ties each number to a decision. These eight cover most single-site and multi-site clinics; add one or two of the optional metrics only if they drive an action.
- Patient volume — visits per day, week and month, split by new vs returning and by provider or location. The headline “are we busy enough, or too busy?” number.
- No-show rate — the share of booked appointments where the patient never arrives. High no-shows waste provider time and distort capacity planning; break it down by provider, day of week and appointment type.
- Average wait time — minutes from check-in to being seen, and time in room. The clearest signal of patient experience and front-desk flow.
- Provider utilization — booked or seen hours against available clinical hours. Shows whether the schedule is full, over-booked, or leaking capacity.
- Payer mix — the breakdown of visits or revenue by payer (commercial, Medicare, Medicaid, self-pay). Drives revenue predictability and contract strategy.
- Revenue per visit — net revenue divided by visits, trended over time and by service line. Separates “busy” from “profitable.”
- Days in A/R — the average number of days to collect after a claim is billed. The single best early warning for billing problems; watch the trend, not just the latest value.
- Patient satisfaction — a rolling survey or NPS-style score with enough responses to be meaningful, shown next to wait time so leaders see the trade-off.
Two optional additions earn their place in some clinics: appointment cycle time (total minutes a patient spends in the building) and claim denial rate (the share of claims rejected on first submission).
A recommended one-page layout
Keep the whole thing to a single screen. Leaders scan it, they do not study it. A layout that works:
- Top row — KPI cards. Four to six cards (patient volume, no-show rate, provider utilization, days in A/R) each showing the value, its target, and a small trend arrow.
- Center — volume trend. A daily or weekly visit trend with a target band, so the pattern is obvious at a glance.
- Right — the money view. A payer-mix bar or donut and a revenue-per-visit trend sitting side by side.
- Bottom — exceptions first. A short table of what breached a threshold this period (for example no-show rate above 15%, wait time above 30 minutes, a provider under 60% utilization) so the eye goes straight to problems.
- Edges — context. A one-line “what changed” commentary box and a visible “data as of” timestamp.
This is the same one-page pattern we use across our dashboard development work: agreed KPIs, named owner, visible refresh, exceptions surfaced first.
Tableau vs Power BI for a clinic dashboard
Both tools build this dashboard well, so choose based on your stack rather than the feature list. Tableau is strong for fast visual exploration and is the natural choice if leadership already lives in Tableau; it pairs with Tableau Cloud for sharing. Power BI is the obvious fit if you are on Microsoft 365, tends to cost less per seat, and has mature row-level security for restricting provider-level data to the right people. In practice the hard part is the data model underneath — cleanly joining scheduling, clinical and billing data — not the tool you draw it in.
Where the data comes from
A clinic dashboard almost always pulls from three systems, which may be separate products or modules of one suite:
- EHR — clinical encounters, appointment status (arrived vs no-show), and diagnoses.
- Practice-management (PM) system — the schedule, provider templates and slots, and check-in/check-out timestamps that drive wait time and utilization.
- Billing / revenue cycle — charges, payments, adjustments and claim status, which feed revenue per visit, days in A/R and payer mix.
Even when these live in one platform, the reporting data usually needs a nightly extract into SQL and a shared patient/visit key so the three sources join cleanly. Keep protected health information governed: report on aggregates, apply role-based access, and use row-level security rather than listing individual patients on a leadership view.
Common pitfalls
- Too many metrics. Twenty-five tiles no one reads. Hold the line at 8 to 10.
- Vanity volume. Busy is not the same as profitable — put revenue per visit next to patient volume.
- Stale data with no refresh stamp. One wrong number and leaders quietly stop trusting the whole board. Show when it last updated.
- Averages that hide problems. A clinic-wide wait-time average hides the one provider running 50 minutes late. Break key metrics down by provider and day.
- No targets. A number with no benchmark cannot drive action. Every KPI needs a target or threshold.
- PHI on a leadership view. Aggregate; never list individual patients on an executive dashboard.
- Undefined terms. “A visit,” “utilization” and “no-show” must mean one thing across the organisation — a governance problem, not a charting one.
Turn your data into decisions
We build clinic and healthcare executive dashboards in Tableau and Power BI, and the data models behind them. Book a free 30-minute analytics assessment and we'll map the fastest path for your team.
Book a Free Analytics AssessmentFAQ
What is a clinic executive dashboard?
A clinic executive dashboard is a single-screen view of the operational and financial KPIs that practice leaders are accountable for — patient volume, no-shows, wait time, provider utilization, payer mix, revenue per visit, days in A/R and patient satisfaction — built on the clinic's EHR, scheduling and billing data and refreshed on a set schedule.
What KPIs belong on a clinic KPI dashboard?
Start with eight: patient volume, no-show rate, average wait time, provider utilization, payer mix, revenue per visit, days in A/R and patient satisfaction. Add appointment cycle time or claim denial rate only if they drive a specific decision. Each tile should answer one question and carry a target.
Should I build a clinic dashboard in Tableau or Power BI?
Either works. Choose Power BI if you are on Microsoft 365 and want lower per-seat cost and strong row-level security; choose Tableau if leadership already uses it or you want fast visual exploration. The data model that joins scheduling, clinical and billing data matters far more than the tool.
Where does the data come from?
Three systems: the EHR (encounters and appointment status), the practice-management system (schedule, slots and check-in timestamps), and billing/revenue cycle (charges, payments and claim status). These are usually combined through a nightly extract into SQL joined on a shared patient and visit key.
How often should a clinic dashboard refresh?
Most clinics refresh overnight so leaders see yesterday's complete numbers each morning. Near-real-time refresh is possible for front-desk flow metrics like wait time, but daily is enough for an executive view — and always show the “data as of” time so no one guesses.