
You open the weekly dashboard and cannot tell if the month is on track. Too many charts compete for attention. Two numbers disagree with last week’s report. Filters take ten seconds to load.
Most of these problems come from two sources: a layout that ignores how people read, and data that is wrong or slow underneath. This guide covers both. It gives you the design principles we apply when we build executive dashboards in Tableau and Power BI, with concrete examples you can use this week.
TL;DR
- Pick one audience and one decision per dashboard. Everything on the page should serve that decision.
- Put the most important number at the top left, large, with a target or status next to it. Put trends in the middle and detail at the bottom.
- Show fewer KPIs, fewer colors and fewer filters than feels natural. Clutter slows every reader down.
- Choose each chart by the question it answers: bars to compare, lines for trends over time.
- A slow or wrong dashboard is usually a data problem. Fix it at the data layer before you redesign the visuals.
Turn your data into decisions
We build Tableau and Power BI dashboards and the data models behind them. Book a free 30-minute analytics assessment and we'll map the fastest path for your team.
Book a Free Analytics AssessmentOn this page
- The three aspects of a great dashboard
- Start with the audience and the decision
- Build a clear hierarchy: the five-second test
- Arrange the layout so the eye knows where to go
- Choose fewer KPIs and tie each to an action
- Match each chart to its question
- Keep interactivity light and accessible
- Fix the data layer before you redesign the visuals
- What we build, and how an engagement works
- Perspective
- A short checklist before you publish
- FAQ
- Sources
The three aspects of a great dashboard
When people ask for the key aspects of dashboard design, the answer comes down to three. An academic textbook on dashboard layout names them as information hierarchy, visual flow and cognitive load management.
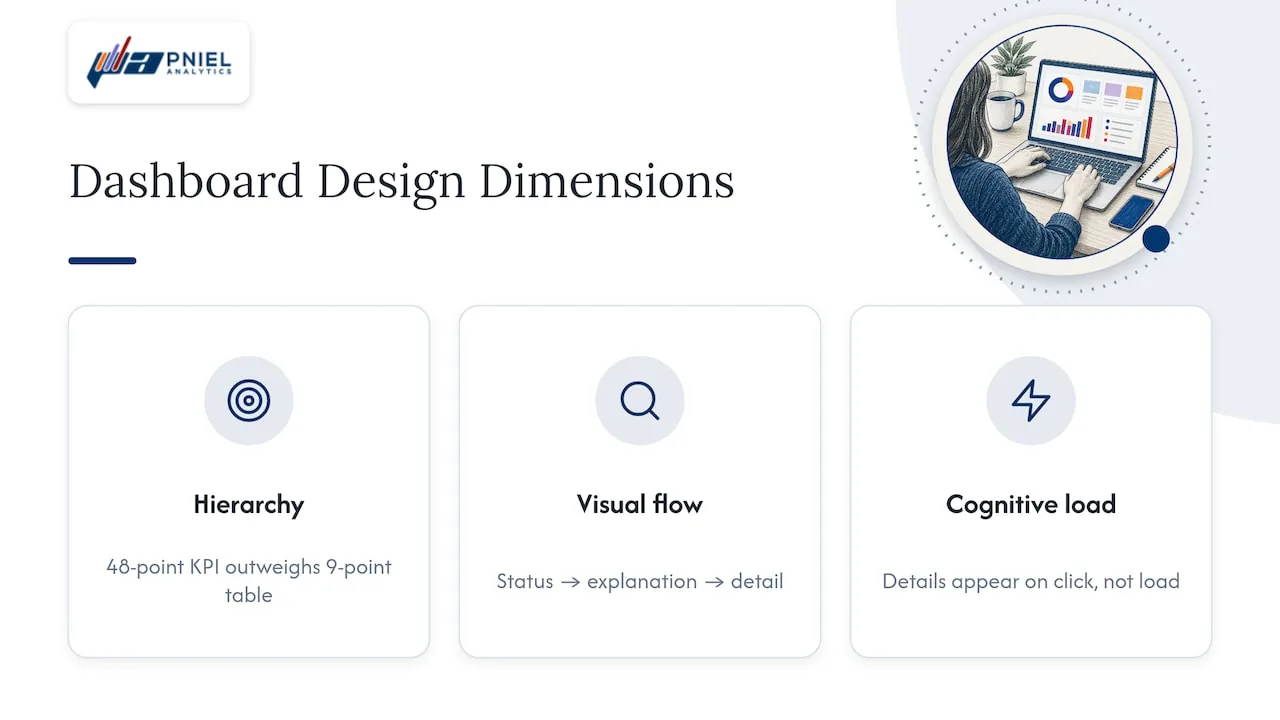
Information hierarchy decides what gets the reader’s eye first. Size, position and emphasis do that work. A revenue-versus-target number at 48 points beats a table at 9 points every time.
Visual flow is the path the eye takes. Alignment, grouping and spacing create a logical order, so the reader moves from status to explanation to detail without hunting.
Cognitive load is how much effort the page costs. White space, short labels and progressive disclosure (detail on click, not on load) keep that cost low.
Every other rule in this article is a way to apply one of these three.
Start with the audience and the decision
Tableau’s own guidance on building dashboards starts with planning: know your audience, check the display size and plan for fast load times. We agree with that order. Layout comes after.
Before we draw anything, we ask three questions:
- Who opens this dashboard, and when? A CFO on Monday morning needs something different from a program manager reviewing grants at month end.
- What decision does it support? “Do we hold or cut the Q3 hiring plan?” is a decision. “Show me sales” is not.
- What action follows a bad number? If no one owns the response, the metric does not belong on the page.
A dashboard built for everyone usually serves no one. Build one view per role. A CTO quoted by TechTarget makes the same point: dashboards made for specific users with a clear purpose become the page those users open first each day.
Research on dashboards in health settings adds a point that applies to any team. Developers should identify metrics the audience values, including whether they trust the data and how it is presented. Trust is a design input. We come back to it in the data section below.
Build a clear hierarchy: the five-second test
A reader should grasp the main message almost at once. A simple check: show the dashboard to someone for five seconds, then cover it. Ask what they saw and what they would do next. If they cannot name the main KPI and whether it is good or bad, the hierarchy needs work.
Nielsen Norman Group explains why this works. Dashboards are meant for information that can be consumed fast, using preattentive attributes such as length, position and color so people see key relationships before they focus.
Here is how we apply it on an executive page:
| Layer | What goes here | Example |
|---|---|---|
| Top | Status against target | Cash on hand vs. plan, with a red, amber or green indicator |
| Middle | Trend and comparison | Monthly revenue by region, last 12 months, with prior year as a thin line |
| Bottom | Detail and follow-up | Invoice-level table of overdue accounts, with owner and days outstanding |
This is a top-to-bottom reading order, the same order a newspaper uses for a story. Each layer answers a different question: are we on track, why is it moving, and who handles it.
Make the key number big and give it context
A bare number does not help. “$4.2M” means little. “$4.2M vs. $4.5M target, 93%” tells the reader where they stand. Always pair a headline KPI with a target, a prior period or a threshold.
In Tableau, a simple calculated field does this. A status field such as IF [Actual] >= [Target] THEN "On track" ELSEIF [Actual] >= 0.9 * [Target] THEN "At risk" ELSE "Behind" END drives color on a KPI card. In Power BI, conditional formatting on a card or a KPI visual does the same job.
Arrange the layout so the eye knows where to go
Tableau’s visual best practices recommend a Z-shaped or newspaper layout, with the most important content at the top or left. They also advise white space to separate sections, larger size for KPIs and summary views, and separate dashboards for desktop, tablet and phone.
A few layout rules we use on almost every build:
- Use a grid. Align every chart to the same left edge and use equal gaps. Ragged edges make a page look broken.
- Group related items. Revenue, margin and cost belong together. Headcount belongs elsewhere.
- Separate with space, not borders. Boxes around every chart add noise.
- Place filters in one spot. Put them across the top or down the left side, with short labels such as “Fiscal year” and “Department.”
- Keep legends next to their charts. Do not make the reader look across the page to decode a color.
- Fit the screen. Microsoft advises that all tiles fit on one screen without scroll bars for dashboards meant to be read at a glance.
If a page needs scrolling, it probably holds two dashboards. Split it.
Design for the device people actually use
An executive may read the dashboard on a phone before a meeting. A layout built for a wide monitor will not fit. Build a phone layout with three or four KPI cards and one trend chart. Tableau supports device-specific layouts, and Power BI offers a mobile layout view for reports. Test both before launch.
Choose fewer KPIs and tie each to an action
Too many KPIs is the most common mistake we see in executive dashboards. A CTO quoted by TechTarget warns that it leads to dashboard fatigue and advises showing only data relevant to the KPI an executive cares about.
A workable limit for a top-level view is five to eight metrics. That is our working guideline, not a published standard. Test each metric with one question: what will someone do if this number turns red?
Examples by role:
- Finance and FP&A: revenue vs. budget, gross margin percentage, operating expense variance, days sales outstanding, forecast accuracy.
- Operations: on-time delivery rate, order backlog, cycle time, defect rate, inventory turns.
- Government program offices: funds obligated vs. funds spent, cases open past the service standard, milestones completed vs. planned.
- Nonprofits: donations vs. goal, donor retention rate, grant spending vs. award, cost per program participant.
If you need help choosing what to measure, an article on operational performance metrics walks through what to track and why. Settle the list first. Then design the page.
Keep definitions on the page. A small info icon with a tooltip that says “Net revenue = gross sales minus returns and discounts” prevents most arguments in meetings.
Match each chart to its question
Chart choice follows the question. Tableau’s guidance says the same: chart choice should depend on the question you are trying to answer.
| Question | Use | Avoid |
|---|---|---|
| How do categories compare? | Horizontal or vertical bar chart, sorted | Pie chart with many slices |
| How has it changed over time? | Line chart | 3D charts of any kind |
| Are we hitting target? | KPI card or bullet chart | Speedometer gauges that waste space |
| Where is it happening? | Map paired with a ranked bar chart | Map alone, with no ranking |
| What is the exact value? | Table | Chart with every data label turned on |
BI documentation points the same way. Omni’s guide recommends line, area or bar charts for trends and bar or bullet charts for ranking.
Microsoft gives specific rules in its Power BI design tips: avoid 3D charts, use bar and column charts to compare values, and limit pie charts to fewer than eight categories. It also advises no more than three or four numerals when displaying numbers. Write “3.4 million” instead of “3,400,000.”
Use color to mean something
Color should carry meaning. Use one neutral base, such as gray or a muted blue, and save red and green for status. A product designer at Qlik, quoted by TechTarget, says wrong color use can break a visualization and is often the first thing people notice.
Two practical rules:
- Use the same color for the same thing everywhere. If “Northeast” is dark blue on one chart, it stays dark blue on all of them.
- Do not rely on red and green alone. Add an icon, a label or an arrow so readers with color vision deficiency can read the status.
Keep interactivity light and accessible
Filters, drill-downs and tooltips help, but each one has a cost. The U.S. Web Design System, the federal government’s design guidance, notes that even simple interactions have a usability cost and that usability and accessibility go together. It also suggests keeping each visualization to two or three concepts.
For public-sector dashboards, the same guidance recommends:
- Provide text for axis values and labels.
- Offer a table of the underlying data.
- Avoid putting key information inside images.
- State the intended message as text, so no one has to guess the conclusion.
These are good habits for private-sector dashboards too. A one-line headline above a chart, such as “Overdue invoices rose 12% in October,” does more than a clever visual. Use a headline like that only when the figure comes from your own data.
Set safe defaults. The first view should be useful with zero clicks. Pick a default date range and a default region, and show them clearly.
Fix the data layer before you redesign the visuals
Some dashboards look fine and still fail. Numbers do not match the finance report. Filters hang. Totals change when you add a field. A new layout will not cure these.
Our approach is SQL-first. When a client brings us a slow or wrong dashboard, we fix it at the data layer before we touch the visuals. These are the issues we check first:
- Wrong grain. Joining an orders table to an invoice lines table can duplicate revenue. Each row must mean one thing.
- Fan-out joins. A one-to-many join inflates totals. We aggregate before joining, for example with a CTE that sums payments per invoice.
- Row-by-row logic in the dashboard. Heavy calculated fields run slowly on large tables. We move that logic into SQL views or a modeled table.
- No shared definitions. If two teams calculate “active customer” differently, no layout fixes it. We write one definition and build it once.
- Live queries on raw tables. Where it fits, we build a summary table that refreshes on a schedule and point the dashboard at it. Tableau extracts and Power BI import mode support this.
Tableau lists planning for fast load times as part of dashboard design. Speed is a design principle. A page that takes 30 seconds to load does not get used.
Trust comes from the same work. When a leader sees the same number in the dashboard and in the monthly report, they stop asking whether it is right and start asking what to do.
What we build, and how an engagement works
Pniel Analytics is a Tableau and Power BI consulting firm based in Newark, Delaware, working with clients across the US. We build executive dashboards, automated reporting and the SQL data pipelines behind them.
Our engagements typically run 4 to 6 weeks. The same team builds and maintains the work, so the people who learn your data stay with it. We are hands-on and structured, with personal service.
We work with finance and FP&A teams, operations leaders, nonprofits, and federal, state and local agencies. We are registered for government work on SAM.gov.
If your dashboard is slow, disputed or ignored, a Tableau consulting engagement is the usual starting point. Teams on Microsoft tools can look at our Power BI consulting work. For definitions, ownership and quality rules, see our data strategy and governance service.
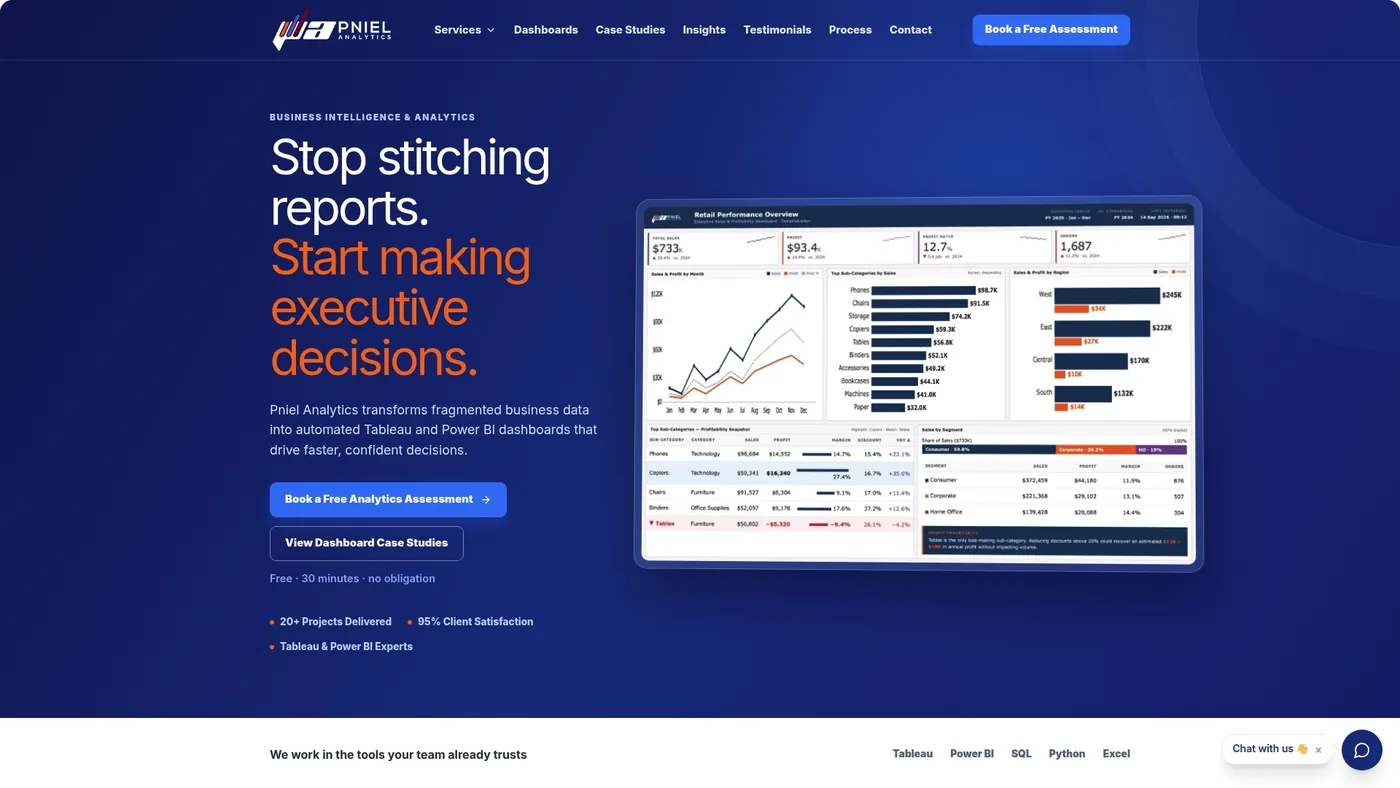
You can book a free assessment and we will review one of your dashboards: the layout, the data behind it and the load time.
Perspective
Most dashboard reviews start with colors and chart types. I recommend starting one step earlier, with a list of the questions the dashboard must answer.
Write each question as a sentence. “Are we collecting cash on pace with the forecast?” is one. Then trace each question to a table and a field. If you cannot trace it, no layout will save the dashboard.
This is why we work SQL-first. The visual layer is the last 20% of the work in terms of effort, but it is the part everyone sees. When the data layer is clean, design choices become simple. You pick the chart that fits the question and the size that matches its importance.
My practical recommendation: before your next dashboard project, run the five-second test on your current dashboard with two colleagues. Then ask your analyst how long the slowest page takes to load. Those two answers tell you whether you need a redesign, a data fix or both.
Frederick Soh
A short checklist before you publish
Use this list on any dashboard before it goes to leadership:
- One audience and one decision are written down.
- The main KPI is at the top left, with a target or status.
- The page passes a five-second test with someone who did not build it.
- Five to eight top-level metrics, each with an owner.
- Each chart fits its question. No 3D, no crowded pies.
- Color has one meaning. Status does not rely on color alone.
- Filters are few, labeled and placed in one spot.
- Totals match the source report.
- Load time is acceptable on the slowest device in the audience.
- A phone or tablet layout exists if executives read on those devices.
FAQ
What is the five-second rule for dashboards?
The rule says a viewer should understand the main message within about five seconds. To test it, show the dashboard for five seconds, hide it and ask what the person saw and what they would do. If they cannot name the key metric and its status, increase its size and remove competing elements.
What are the three layers of a dashboard?
A common structure puts status against target at the top, trends and comparisons in the middle, and detail at the bottom. This follows an inverted pyramid, the way a news story moves from headline to depth. We use it on executive dashboards because it matches how leaders read: first “are we on track,” then “why,” then “who acts.”
How many KPIs should an executive dashboard have?
There is no official number. Our working guideline is five to eight at the top level, each tied to an action and an owner. Industry voices warn that too many KPIs cause dashboard fatigue, so put secondary metrics on drill-down pages.
Should I fix the data or the design first?
Check the data first if the dashboard is slow or its numbers are disputed. Wrong grain, duplicated joins and heavy calculations in the dashboard cause these problems, and a new layout will not remove them. If the data is sound and people still struggle, work on hierarchy and layout.
Do the same principles apply in Tableau and Power BI?
Yes. Hierarchy, layout, chart choice and color rules apply in both tools. The features differ: Tableau offers device-specific layouts and Power BI offers a mobile layout view. We deliver in both, with Tableau as our core platform.
Sources
- Chapter 5.6: Dashboard Design and Layout Principles, Excelsior University
- 10 Best Practices for Building Effective Dashboards, Tableau
- Visual Best Practices, Tableau
- Tips for Designing a Great Power BI Dashboard, Microsoft Learn
- Dashboards: Making Charts and Graphs Easier to Understand, Nielsen Norman Group
- Data visualizations, U.S. Web Design System
- 10 dashboard design principles and best practices, TechTarget
- From glitter to gold: recommendations for effective dashboards, Implementation Science
- Dashboard best practices, Omni Docs
- Operational Performance Metrics: What to Track and Why
This article is for general informational purposes and reflects Pniel Analytics’ experience delivering BI and analytics work. It is not legal, financial, or compliance advice. For guidance specific to your data environment, contact us at fsoh@pnielanalytics.com.