
To connect Power BI to Salesforce, open Power BI Desktop, select Get data → Salesforce Objects, sign in with an API-enabled production Salesforce account, choose the objects you need, and publish to the Power BI service with a scheduled refresh.
Your sales leaders want pipeline numbers in Power BI. The Salesforce report says one total and the dashboard says another. Or the refresh fails on Monday morning, right before the forecast meeting. Both problems usually trace back to how the connection was set up, not to the visuals.
This guide shows how to connect Power BI to Salesforce, which connector to pick, when to stage the data in SQL Server first, and what limits to plan for. It is written for operations, finance and program leaders who own the numbers and need the setup to hold.
TL;DR
- Power BI has two Salesforce connectors. Objects reads tables and returns all rows. Reports reads saved Salesforce reports and is capped at 2,000 rows.
- You need API access on a production Salesforce account, a Power BI Pro or Premium Per User license, and permission granted to the Power BI app at sign-in.
- Import mode shows data as of the last refresh. DirectQuery sends a query to the source for each visual. Neither makes Salesforce data live by default.
- For larger or shared datasets, we stage Salesforce data in SQL Server first. Power BI then reads a clean, fast model.
- Pniel Analytics fixes slow or wrong dashboards at the data layer before redesigning any visual.
Turn your data into decisions
We build Tableau and Power BI dashboards and the data models behind them. Book a free 30-minute analytics assessment and we'll map the fastest path for your team.
Book a Free Analytics AssessmentOn this page
- What you need before you connect
- Salesforce Objects or Salesforce Reports: which connector to use
- How to connect Power BI to Salesforce, step by step
- Choosing a connection mode for Salesforce data
- When to stage Salesforce data in SQL Server first
- How to connect Power BI to SQL Server
- Refresh schedules and limits to plan around
- Secure the connection
- Common problems and where they come from
- Work with Pniel Analytics on your Salesforce reporting
- Author Perspective
- FAQ
- Sources
What you need before you connect
Check the prerequisites first. Most failed connections come from a missing permission, not a bad setting in Power BI.
According to Microsoft’s Salesforce connection guide, you need:
- Power BI Desktop (free) to build the report, and a Power BI Pro or Premium Per User license to publish, share and schedule refresh.
- A production Salesforce org with the API Enabled permission on the connecting user.
- Permission for the Power BI app to access Salesforce, granted at sign-in.
- Enough Salesforce API calls to pull and refresh the data.
- A valid authentication token.
Two details trip people up. Salesforce limits authentication tokens to five per application, so the same guide advises importing five or fewer Salesforce datasets. And the Salesforce Objects connector documentation says trial accounts do not have API access, Lightning URLs are not supported, and custom URLs work only on the salesforce.com and cloudforce.com domains.
Open the user’s profile in Salesforce and confirm the API Enabled box is checked. If you use a dedicated integration user, give it only the objects it needs. We come back to this in the security section.
If your team is still building the internal case for the work, the Power BI for FP&A dashboard guide shows what a minimal first dashboard looks like.
Salesforce Objects or Salesforce Reports: which connector to use
Power BI Desktop lists two Salesforce connectors. They read different things.
Salesforce Reports pulls from reports your Salesforce users already built. That feels convenient. But Microsoft documents that Salesforce limits report rows to 2,000. The same page says the Objects connector in Power BI Desktop can retrieve all rows from individual tables and recreate the report without that limit.
The cap can hide. Metrica Software describes a report with 2,001 or more records returning exactly 2,000 rows with no error or warning. The dataset loads normally. Totals are simply lower than expected.
That is a wrong dashboard with no visible fault. A finance leader sees closed-won revenue that is short, and nobody knows why.
| Question | Salesforce Objects | Salesforce Reports |
|---|---|---|
| What it reads | Standard and custom objects (Opportunity, Account, Lead, custom tables) | Saved Salesforce reports |
| Row limit | No 2,000-row report cap | 2,000 rows per report |
| Who defines the logic | You, in Power Query and the data model | The Salesforce admin, in the report |
| Best for | Pipeline, revenue and activity analysis at full volume | Small, fixed lists that stay under the cap |
| Main risk | Field limits on wide queries | Silently low totals on large reports |
For anything that feeds an executive dashboard, we start with Objects. Reports works for a short list that will never grow past the cap.
How to connect Power BI to Salesforce, step by step
The steps below use Power BI Desktop and the Objects connector.
- Open Power BI Desktop. Select Get data, then search for Salesforce.
- Choose Salesforce Objects. Pick Production as the environment. Use a custom URL only if your org uses a supported salesforce.com or cloudforce.com domain.
- Select Sign in and authenticate with Salesforce. Approve the Power BI app when Salesforce asks.
- In the navigator, pick the objects you need. Start with Opportunity, Account, User and a small set of lookup tables.
- Select Transform data before loading. Remove columns you do not need and set data types.
- Load the data, build the relationships, and publish to the Power BI service.
Step 5 matters more than it looks. The Objects connector documentation says there is a limit on the number of fields a query can contain. If you see the error that the query is selecting too many fields or the filters are too complicated, use the Select Query advanced option and name only the fields you need.
A good first field list for a pipeline dashboard:
- Opportunity: Id, Name, AccountId, OwnerId, StageName, Amount, CloseDate, CreatedDate, IsClosed, IsWon
- Account: Id, Name, Industry, BillingState
- User: Id, Name, ManagerId
That is enough for pipeline by stage, win rate by owner and closed revenue by month.
If sign-in fails
Check session settings. The Salesforce Reports connector documentation states that the setting to lock sessions to the originating IP address must be disabled for the connection to work. Ask your Salesforce admin to review it.
Also confirm the user can log in with the API under your single sign-on and multi-factor rules. Atspark notes that Salesforce enforces MFA and OAuth 2.0, and that the account needs a permission set allowing API logins while meeting those requirements.
Choosing a connection mode for Salesforce data
Power BI can hold a copy of the data (Import) or query the source as people use the report (DirectQuery). Microsoft explains the difference. With Import, visuals do not reflect source changes until you refresh. With DirectQuery, nothing is imported at load time. Each visual sends one or more queries, so speed depends on the source and on any network or gateway overhead.
For Salesforce, this means:
- Import gives fast visuals and full control in the model. Data is as fresh as the last refresh.
- DirectQuery gives fresher numbers. But every filter click goes back to the source, which can feel slow and uses API capacity.
Most executive reporting does not need second-by-second data. A pipeline review needs a number that is correct and agreed. The case for unified views of operational data is covered in these benefits of unified dashboards. The same logic applies to CRM: one trusted model beats several partial ones.
Pick the mode by asking how often a decision changes because of new data. If the answer is daily, Import with a scheduled refresh fits.
When to stage Salesforce data in SQL Server first
Connecting Power BI straight to Salesforce works well for a small model. It starts to strain when:
- Several reports need the same Salesforce data and each one refreshes it separately.
- You need to join Salesforce to finance, ERP or HR data.
- You hit field limits, API call limits or the five-token limit.
- History matters. Salesforce shows current state, and you want to trend how a deal moved.
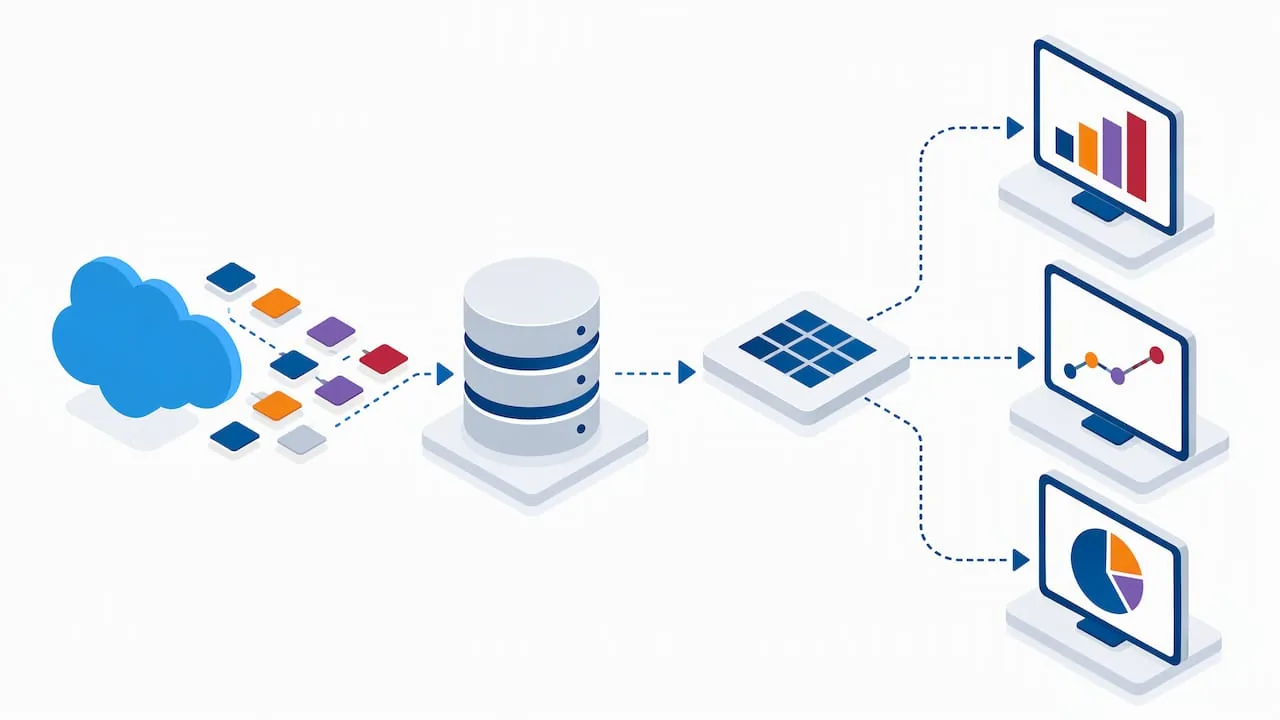
In those cases we load Salesforce objects into SQL Server on a schedule. Power BI then connects to SQL Server. This is the SQL-first approach we use at Pniel Analytics. The data is cleaned and modeled once, and every dashboard reads the same result.
A simple pattern looks like this:
- Land raw Salesforce tables in a staging schema on a schedule, using Azure Data Factory, SSIS, a sync tool such as Fivetran or Skyvia, or a scheduled Python script.
- Build views in a reporting schema that rename fields, filter deleted records and add business rules.
- Point Power BI at the views.
For example, a view that defines closed revenue once:
CREATE VIEW reporting.ClosedRevenue AS
SELECT o.Id,
       o.AccountId,
       o.OwnerId,
       o.Amount,
       CAST(o.CloseDate AS date) AS CloseDate
FROM staging.Opportunity AS o
WHERE o.IsClosed = 1
  AND o.IsWon = 1
  AND o.IsDeleted = 0;
Now “closed revenue” means the same thing in every report. If the definition changes, you change one view.
This also makes a model easier to shape. Our guide on choosing a star or snowflake schema covers how to lay out facts and dimensions so reports stay fast.
How to connect Power BI to SQL Server
Once Salesforce data sits in SQL Server, the connection is routine.
- In Power BI Desktop, select Get data, then SQL Server.
- Enter the server and database names.
- Choose Import or DirectQuery.
- Select Windows or database credentials.
- Pick the views you built and load them.
Dataedo’s guide lists what you need: access to the SQL instance (host and port, 1433 by default), credentials with read permission on the required schemas, and an on-premises data gateway for cloud refresh or DirectQuery. It also recommends encrypted connections, a sensible command timeout, and loading only needed columns. For heavy fact tables, it favors views with pre-aggregation or filtering.
Gateway settings
If SQL Server is on-premises, the Power BI service needs a gateway. Microsoft’s gateway documentation says the server and database names must match between Power BI Desktop and the gateway. For SQL Server, choose Windows or Basic (SQL authentication). The service encrypts the credentials so they cannot be decrypted in the cloud, and the gateway machine decrypts them only when it reaches the data source.
For DirectQuery on sources other than Azure SQL Database, Azure Synapse, Amazon Redshift and Snowflake, a gateway is required. For per-user security there, use row-level security or configure Kerberos constrained authentication.
We handle Power BI and Salesforce integration, including the SQL Server staging approach.
Refresh schedules and limits to plan around
Import mode depends on scheduled refresh, so plan the schedule early.
Microsoft’s scheduled refresh documentation states:
- Power BI Pro allows up to 8 scheduled refreshes per day.
- Premium Per User and Premium or Fabric capacity allow up to 48.
- Refresh starts within 15 minutes of the slot as a target. A delay of up to one hour can occur if resources are not available.
- After two months of inactivity, scheduled refresh is paused and the owner is emailed.
That last point catches teams with quarterly reports. If nobody opens the report for two months, refresh stops. Assign an owner who gets the email.
Eight refreshes a day suits most finance and operations reporting. A common pattern is early morning, midday and end of day. If Salesforce volume is large, add incremental refresh so each run loads only new and changed rows instead of the full history.
Secure the connection
Treat the Salesforce link like any other system account.
Token Security’s guidance recommends:
- A dedicated integration user per connected app, with minimum permissions.
- Monitoring connected app activity for unusual data access.
- Rotating OAuth tokens regularly.
- Keeping an inventory of connected apps, with an owner and a business purpose for each.
The same source notes that OAuth is Salesforce’s recommended method because it issues scoped access tokens instead of exposing a user’s credentials. Older security-token-plus-password methods give less granular control.
For public-sector teams, add one more step. Confirm with your security office which Salesforce environment and which Power BI service offering your agency is approved to use before you build.
Inside Power BI, restrict who sees which records. Use row-level security so a regional manager sees only their region. Define the roles in the model and test them with the View as role feature before sharing.
Common problems and where they come from
| Symptom | Likely cause | Fix |
|---|---|---|
| Totals lower than Salesforce | Reports connector hit the 2,000-row cap | Switch to Objects and rebuild the logic in the model |
| Query fails with too many fields | Wide object with all columns selected | Use Select Query and list only needed fields |
| Sign-in succeeds, then fails | Session locked to originating IP | Disable that session setting in Salesforce |
| Refresh fails after weeks | Expired or revoked token, or MFA change | Re-authenticate and review the integration user |
| Dashboard is slow | Large wide tables, heavy DAX on raw data | Stage in SQL Server, shape a star schema, load fewer columns |
| Refresh stopped on its own | Two months with no use | Open the report, resume refresh, set an owner |
Notice how most fixes sit in the data layer. That is where we start. If a dashboard is slow or shows the wrong number, we check the source queries, the joins and the model before touching a chart.
Work with Pniel Analytics on your Salesforce reporting
We build Power BI and Tableau dashboards on Salesforce data, and we build the SQL pipelines behind them. Typical engagements run 4 to 6 weeks. The same team that builds the work maintains it, so the person who knows why a field is filtered is still there when you ask.
See our Power BI consulting services, or look at a sales performance dashboard in Power BI to see how pipeline reporting can be laid out. To talk through your Salesforce setup, book a free assessment.
Author Perspective
Most Salesforce dashboard problems we hear about start the same way. Someone connected Power BI to a saved report, because it was the fastest path. Months later the numbers drift and nobody can say why.
Our recommendation is simple. Use the Objects connector, define your business rules once, and put them in SQL where they can be read and reviewed. A view named closed revenue is easier to trust than a measure buried in a report file.
Then check the volume. If several reports share Salesforce data, or you need history, stage it in SQL Server. If only one small report uses it, connect directly and keep the field list short.
Finally, name an owner for the integration user, the refresh schedule and the token. Reporting breaks when nobody owns the plumbing. Fix the data layer first. Redesign visuals after.
Frederick Soh
FAQ
Does Power BI have a native Salesforce connector?
Yes. Power BI Desktop includes Salesforce Objects and Salesforce Reports connectors. Objects reads tables and returns all rows. Reports reads saved reports and is limited to 2,000 rows. You need API access on a production Salesforce account, and a Pro or Premium Per User license to publish and refresh.
Can Power BI show Salesforce data in real time?
Not by default. With Import, visuals update after a refresh. DirectQuery sends queries to the source as people use the report, so results are fresher but speed depends on the source and any gateway. Most teams pick scheduled refresh for reliable, fast reports.
Why do my Power BI totals not match Salesforce?
The most common cause is the Reports connector. It returns up to 2,000 rows per call and gives no warning when a report is larger. Switch to the Objects connector and compare row counts against Salesforce. Also compare filters such as deleted records and closed status.
How often can Salesforce data refresh in Power BI?
Power BI Pro allows up to 8 scheduled refreshes per day. Premium Per User and Premium or Fabric capacity allow up to 48. Refresh may start up to an hour late if resources are tight, so avoid scheduling right before a meeting.
Should I connect Power BI to SQL Server instead of Salesforce?
When several reports share Salesforce data, or you need to join it with finance or ERP data, staging in SQL Server is the better design. Power BI then reads views with the business rules already applied. For one small report, a direct connection is enough.
Sources
- Connect to Salesforce with Power BI, Microsoft Learn
- Power Query Salesforce Objects connector, Microsoft Learn
- Power Query Salesforce Reports connector, Microsoft Learn
- Salesforce Objects vs Reports connector in Power BI, Metrica Software
- Connect Power BI to Salesforce, Atspark
- DirectQuery in Power BI, Microsoft Learn
- Use DirectQuery in Power BI Desktop, Microsoft Learn
- How to connect SQL Server to Power BI, Dataedo
- Add or remove a gateway data source, Microsoft Learn
- Configure scheduled refresh, Microsoft Learn
- Salesforce Connected Apps security, Token Security
Related insights
- Power BI Incremental Refresh: Setup, Limits & Pitfalls
- Power BI for FP&A: Build a Minimal Dashboard in 5 Steps
- Cut Power BI Latency: 5 Decision Questions to Pick Star or Snowflake Schema
This article is for general informational purposes and reflects Pniel Analytics’ experience delivering BI and analytics work. It is not legal, financial, or compliance advice. For guidance specific to your data environment, contact us at fsoh@pnielanalytics.com.