Your team has a risk score, and nobody acts on it. The numbers arrive late, they disagree with the finance report, or clinicians stop trusting the alerts. This is the usual way healthcare predictive analytics fails. The model is rarely the cause. The data feeding it and the dashboard showing it usually are.
This guide covers what predictive analytics does in a health system, where U.S. hospitals use it, how readmission prediction works, and what to check before you rely on a model. It is written for operations, finance and program leaders, not data engineers. At Pniel Analytics we work SQL-first: we fix slow or wrong dashboards at the data layer before we redesign any visuals.
TL;DR
- Predictive analytics uses past and current data to forecast what may happen next. Prescriptive analytics then suggests what to do about it.
- The most common hospital uses are risk prediction for inpatients and outpatients, scheduling, billing and capacity planning.
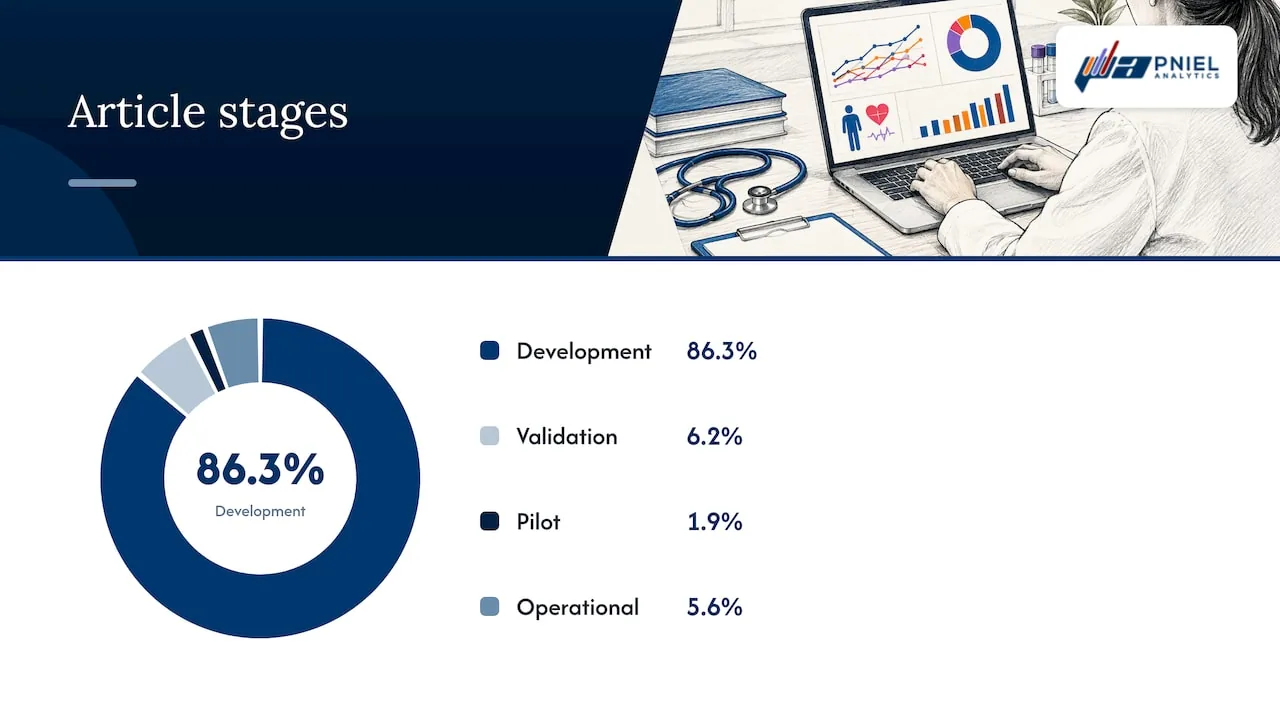
- Most published models are still at the development stage. Few document a clear path from the prediction to a decision.
- Data quality, workflow fit and ongoing monitoring decide whether a model helps. A good model on bad data does not.
- A clean SQL layer and a dashboard built around the decision turn a score into action.
Turn your data into decisions
We build Tableau and Power BI dashboards and the data models behind them. Book a free 30-minute analytics assessment and we'll map the fastest path for your team.
Book a Free Analytics AssessmentOn this page
What predictive analytics means in healthcare
Health data analysis comes in four common types.
Most health systems already do the first two well. A monthly report of discharges by unit is descriptive. A drill-down on why length of stay rose in one unit is diagnostic. Predictive work adds a forward-looking number, such as the chance a patient returns within 30 days or the expected bed demand next week.
Where U.S. hospitals use predictive analytics
Use is already wide. Models in use there flag patients at risk of deterioration, patients who have sepsis, and patients at high risk of near-term mortality. The stated aim is to help clinicians and staff make clinical decisions in real time and raise operational efficiency.
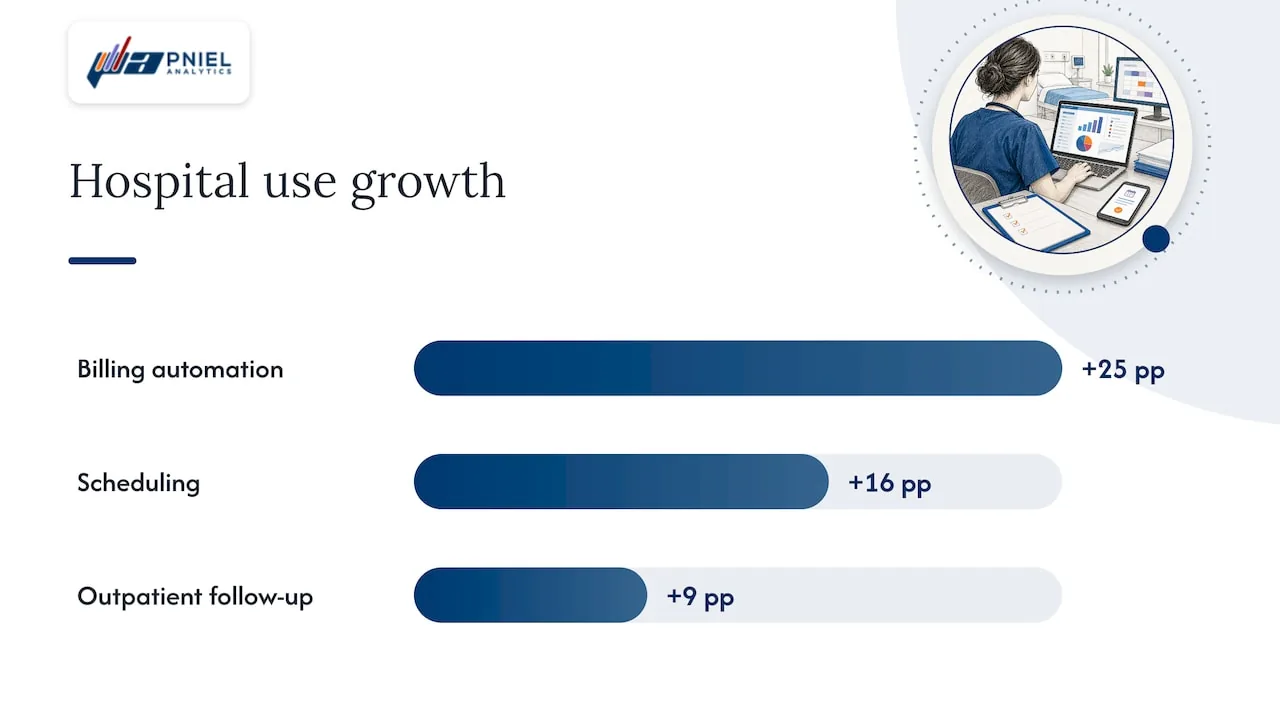
The federal data tells a similar story. An ONC data brief on hospital use of predictive AI reports that hospital use grew between 2023 and 2024 for three tasks:
- Simplifying or automating billing: up 25 percentage points.
- Facilitating scheduling: up 16 percentage points.
- Identifying high-risk outpatients to inform follow-up care: up 9 percentage points.
The same brief notes that the two most common uses remained predicting health trajectories or risk for inpatients and identifying high-risk outpatients for follow-up.
It names three main reasons to use it: better quality of care, lower costs, and fewer readmissions with better hospital operations.
Clinical uses
Clinical models estimate risk for an individual patient. Examples include deterioration, sepsis and near-term mortality. The output is a score or a flag that a nurse or physician sees in the workflow.
Operational and financial uses
Operations and finance leaders use forecasts of volume, no-shows, staffing needs and billing. A 2026 PMC study describes key uses including population health management, readmission-risk prediction, operational forecasting and real-time monitoring through connected devices. It frames them as workable when supported by rigorous validation, explainability, ethical governance and transparent data practices.
Operational predictions often reach patients through front-office tools as well.
How hospital readmission prediction works
Readmission prediction is the use case most leaders ask about. The goal is simple: find patients likely to return soon after discharge, so the care team can act before they do.
It predicts each patient’s risk level and it predicts when readmission problems are likely to occur. Combining the two supports personalized care plans, helps set the timing of interventions and helps allocate care-team resources.
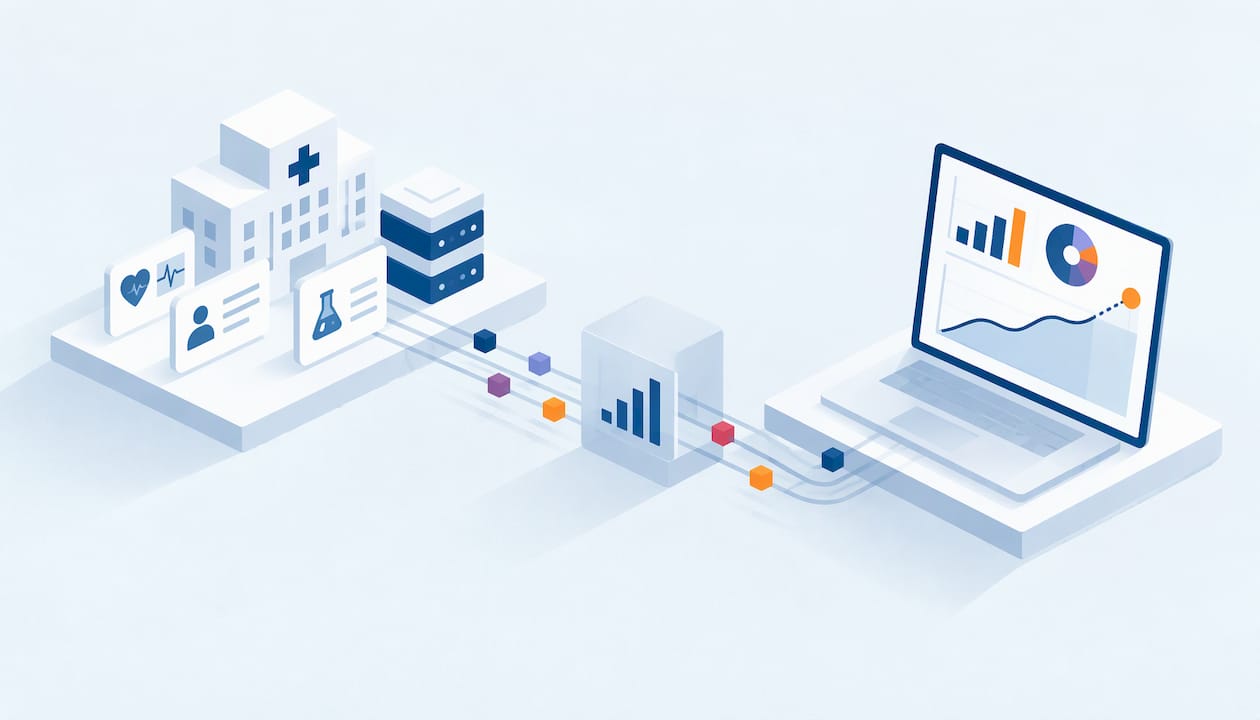
In practice, the pipeline has these parts:
- Source data. Admissions, discharges, diagnoses, procedures, medications, labs and prior utilization, usually from the EHR and billing systems.
- A patient-level table. One row per discharge, with features such as length of stay, number of prior admissions and discharge disposition.
- A model. It scores each discharge for risk.
- A decision view. A dashboard that lists who needs follow-up, sorted by risk and by the day the call or visit is due.
- A feedback loop. Actual readmissions flow back to check whether the scores held up.
Steps 2, 4 and 5 are data and reporting work. They are where many projects stall.
Why the policy context matters
Readmissions carry financial weight. The Hospital Readmissions Reduction Program began in 2010 under the Affordable Care Act.
That adjustment makes coding a data quality issue. The same JAMA Internal Medicine study found that 63.1% of the drop in risk-adjusted readmission rates after the program began was due to increases in coded severity of illness, not underlying improvements in care delivery. For anyone building a readmission dashboard, this is a reminder to define each measure and its coding inputs in writing.
What good data looks like for a prediction model
A model learns from the table you give it. If the table is wrong, the score is wrong, and it will look precise while it is wrong.
A 2026 PMC study of embedding prediction models in clinical care found that missing, delayed or inconsistent vital signs and lab values reduced model performance. They also demanded extensive preprocessing pipelines and ongoing monitoring of input streams.
This is where SQL matters. Typical checks we run at the data layer before any model or visual work:
- Duplicate encounters. Count discharges per encounter ID. More than one row per ID inflates every rate downstream.
- Date logic. Confirm that discharge dates never fall before admission dates, and that readmission windows count days from the right discharge.
- Missing values. Report null rates by column and by facility. A field that is empty at one site is a site problem, not a patient trait.
- Key matching. Test that patient IDs join across the EHR, billing and scheduling extracts.
- Definitions. Write one SQL view for each KPI, so finance and clinical teams read the same number.
The data quality management guide on our site goes through this kind of work in more detail. Healthcare teams also need to handle protected health information correctly. Our article on HIPAA compliant analytics lays out nine steps for keeping PHI out of the wrong places.
How to judge whether a model is trustworthy
Published models vary widely in quality. A critical appraisal of 81 readmission risk models found they followed only 6.8 recommendations (45%) on average. Common gaps:
| Gap found | Share of models |
|---|---|
| Did not account for readmission at other institutions | 93% |
| Did not account for missing data | 68% |
| Did not discuss data preprocessing | 67% |
| Did not internally validate | 12% |
Turn these into questions for any model your team is considering:
- Does it see readmissions at other hospitals, or only your own?
- How does it treat missing values?
- How was the data cleaned, and is that documented?
- Was it validated on data it was not trained on?
These are plain questions an operations or finance leader can ask. They do not need a statistics degree.
From development to daily use
Building a model is the easy part to start. Using it in daily work is harder. Only 10 (6.2%) were at validation, 3 (1.9%) at pilot implementation and 9 (5.6%) at operational deployment.
The most frequent barriers were data quality and interoperability (112 articles, 69.6%) and validation and transportability (104 articles, 64.6%).
The same review found a gap between claim and action. Of the articles, 118 (73.3%) were positioned as relevant to resource allocation or capacity planning. Only 9 (5.6%) documented a pathway from output to decision, and 14 (8.7%) reported routine workflow integration.
The lesson for a program leader: before you fund a model, define the decision. Who sees the score? What do they do with it? By when? A dashboard built around that decision is part of the project, not an afterthought.
Its reviewers note that electronic health record data, linkage with demographic and socioeconomic information, high-capacity computing and new machine learning methods have changed the field.
Risks to plan for
Good planning covers the known risks up front.
Workflow fit and alert fatigue
The 2026 PMC study on embedding models names workflow misalignment, alert fatigue, lack of transparency, data quality and weak governance as the major barriers. High alert rates led staff to override or disable notifications. The authors recommend aligning triggers and outputs with local work practices while keeping clinician autonomy. They also note that differences in documentation templates across units were linked to inconsistent model performance.
A practical response is a ranked worklist instead of a stream of pop-up alerts. Set the threshold with the people who will act on it, and review it after launch.
Explainability
It says evidence-based medicine rests on high standards of explainability, which challenges acceptance among healthcare stakeholders. Show the drivers behind each score on the dashboard, such as prior admissions or length of stay, so a clinician can see why a patient was flagged.
Privacy
The same JMIR article flags privacy and consent. It notes that data from wearables and apps are not widely covered by health information legislation, and that de-identified data may be re-identified when linked with other datasets. Keep access controlled, document what each dataset contains and involve your compliance officer before linking new sources.
Drift over time
The JMIR article also notes that data used to train an algorithm can change or go out of date, a problem called concept drift. Those overseeing a model need a way to tell how it handles new data.
In a dashboard, drift shows up as a trend: predicted risk against actual readmissions by month. When the gap widens, someone reviews the model.
A practical path to your first predictive use case
Use this order. It keeps the work tied to a decision.
- Pick one decision. For example: which discharged patients get a follow-up call within 48 hours.
- Name the owner. One person or team acts on the output.
- Define the measure. Write the readmission window, the included conditions and the exclusions in plain language.
- Audit the data. Run the SQL checks above on a sample of discharges.
- Build the patient-level table. One governed view that every report and model reads from.
- Start with descriptive reporting. Show current readmission rates by unit and condition. Leaders see the baseline first.
- Add the risk score. Place it in a ranked worklist with its drivers.
- Track results. Compare predictions with outcomes every month and review thresholds.
The healthcare KPI dashboard playbook on our site helps with steps 3 and 6. Our healthcare analytics articles cover related topics.
How Pniel Analytics supports predictive analytics
We build the data layer, the dashboards and the analytics on top. Our Advanced & Predictive Analytics service sits alongside Tableau consulting, Power BI consulting and data strategy and governance. Tableau is our core platform, and we also deliver in Power BI.
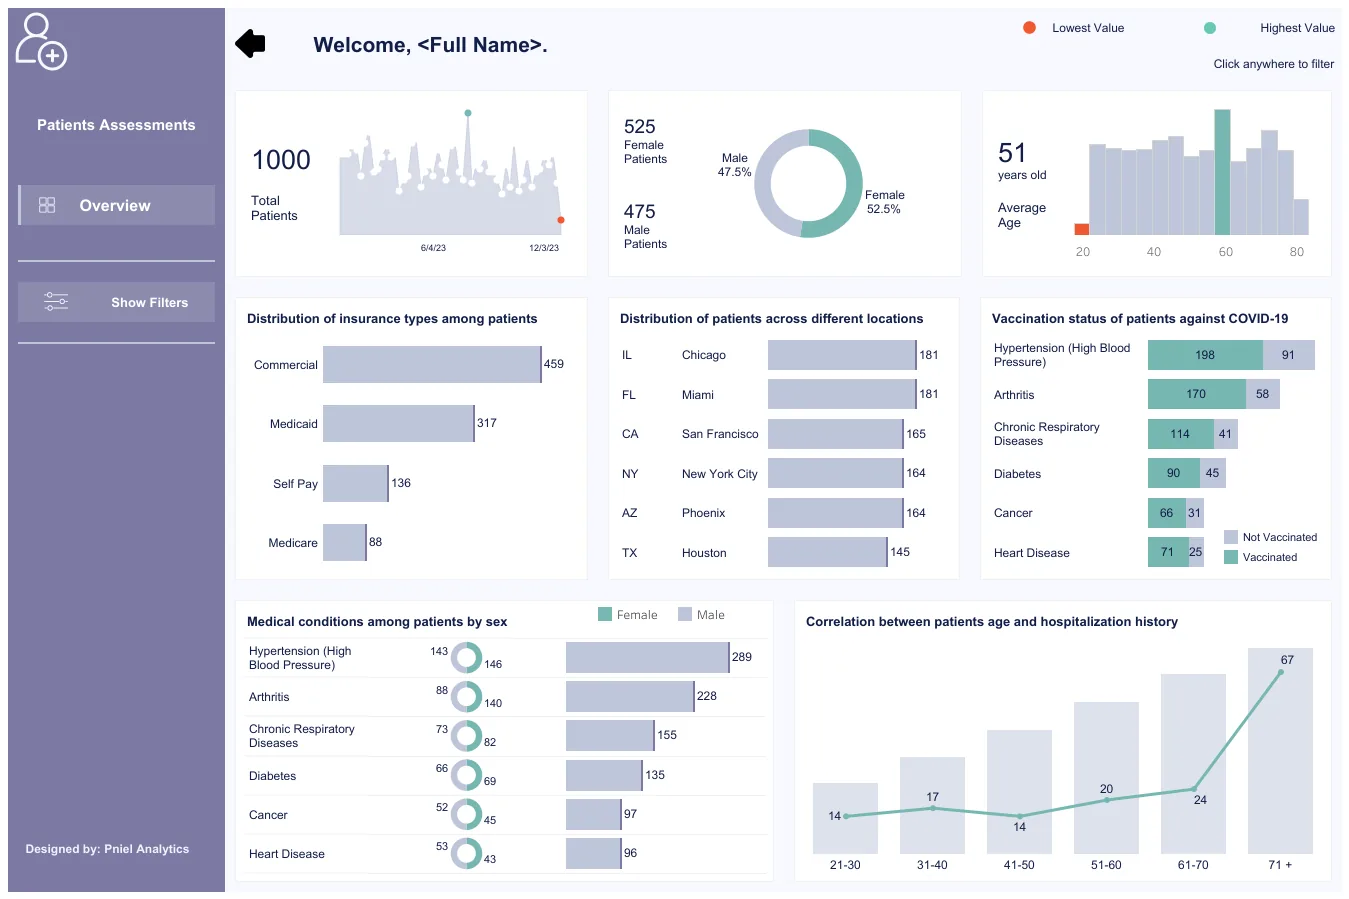
Our approach is SQL-first. When a dashboard is slow or shows the wrong number, we fix the data behind it first and redesign the visuals second. Engagements typically run 4 to 6 weeks, and the same team builds and maintains the work. Pniel Analytics is registered for government work on SAM.gov, and we serve public-sector teams as well as private-sector leaders. You can see a healthcare example in our patient assessment analytics sample dashboard.
If your team has a risk score nobody uses or a readmission report nobody trusts, book a free assessment through our Tableau Consulting page.
Our perspective
We recommend that leaders start with the report, not the model. Most teams that want predictions do not yet have one trusted readmission rate. If finance, quality and operations each report a different number, a model will add a fourth.
Our advice is to fix the definitions in SQL first. Build one governed view per measure. Then build the dashboard around a single decision, with a named owner. Only then add a score.
We also recommend keeping the same team on the work after launch. Models drift, source systems change and thresholds need review. A team that built the data layer can find the cause of a wrong number quickly. That is why we build and maintain the work with the same people.
Frederick Soh
FAQ
What is healthcare predictive analytics used for?
It is used to forecast patient risk, demand and operational needs. Common uses include inpatient deterioration, high-risk outpatient follow-up, scheduling, billing and readmission risk. ONC data shows hospital use of predictive AI for these tasks grew from 2023 to 2024.
How is predictive analytics different from prescriptive analytics?
Predictive analytics forecasts what could happen. Prescriptive analytics suggests what to do in response. A readmission score is predictive. A recommended follow-up plan based on that score is prescriptive.
What data do you need for hospital readmission prediction?
You need admission and discharge records, diagnoses, procedures, labs, medications and prior utilization, joined at the patient level. The data must be complete and consistent. Missing or delayed values reduce model performance, as the 2026 PMC study on embedding models found.
How long does a predictive analytics project take?
Pniel Analytics engagements typically run 4 to 6 weeks. The scope depends on the state of your data and the decision you want to support. A free assessment is the first step to define it.
Sources
- ONC: Hospital Trends in the Use, Evaluation, and Governance of Predictive AI, 2023-2024
- Employing AI-driven predictive analytics to enhance patient outcomes (PMC, 2026)
- Strategies for Embedding Prediction Models in Clinical Decision-Making (PMC, 2026)
- Published models that predict hospital readmission: a critical appraisal (PMC)
Related insights
This article is for general informational purposes and reflects Pniel Analytics’ experience delivering BI and analytics work. It is not legal, financial, or compliance advice. For guidance specific to your data environment, contact us at fsoh@pnielanalytics.com.