
Your monthly revenue line looks fine until you turn on the forecast. Then the projection shoots up, flattens, or throws an error. Most of the time the cause sits in the data, not in the chart. This guide shows how to build a forecast in Tableau, which settings matter, how to read the accuracy fields, and when the built-in feature is the wrong tool.
TL;DR
- Tableau forecasting needs a date (or integer) field and a measure. It uses exponential smoothing and picks the best of up to eight models for you.
- Seasonal forecasts need more history. A twelve-month cycle needs at least 24 data points.
- Check every forecast with the Quality and Precision results and the prediction interval before you show it to leadership.
- Gaps, partial periods, zero values and oversized queries cause most forecast errors. Fix them in the data layer first.
- For multi-variable questions such as churn or propensity scoring, you need predictive modeling functions or an external model.
Turn your data into decisions
We build Tableau and Power BI dashboards and the data models behind them. Book a free 30-minute analytics assessment and we'll map the fastest path for your team.
Book a Free Analytics AssessmentOn this page
- What you need before you turn the forecast on
- Create a forecast in Tableau, step by step
- Forecast Options: the settings that change the answer
- Check accuracy and uncertainty before you share it
- Why forecasts fail, and how to fix them
- Forecasts for year-to-date and partial periods
- Tableau predictive analytics beyond the Forecast button
- Where teams use Tableau forecasting
- Perspective: fix the data before you forecast
- Work with Pniel Analytics on forecasting
- FAQ
- Sources
What you need before you turn the forecast on
A forecast needs a view with at least one date dimension and one measure. Tableau’s help page on creating a forecast lists the view layouts that work:
- The measure on Rows and a continuous date on Columns.
- The measure on Columns and a continuous date on Rows.
- The measure on Rows or Columns with discrete dates, where at least one date level is Year.
- The measure on the Marks card with a continuous or discrete date on Rows, Columns or Marks.
A forecast can also run without a date, if the view has a dimension with integer values.
How much history is enough
Tableau needs at least five data points to estimate a trend. To estimate seasonality it needs enough data for two seasons, or one season plus five periods. In practice, according to Tableau’s explanation of how forecasting works, a four-quarter cycle needs at least nine data points. A twelve-month cycle needs at least 24.
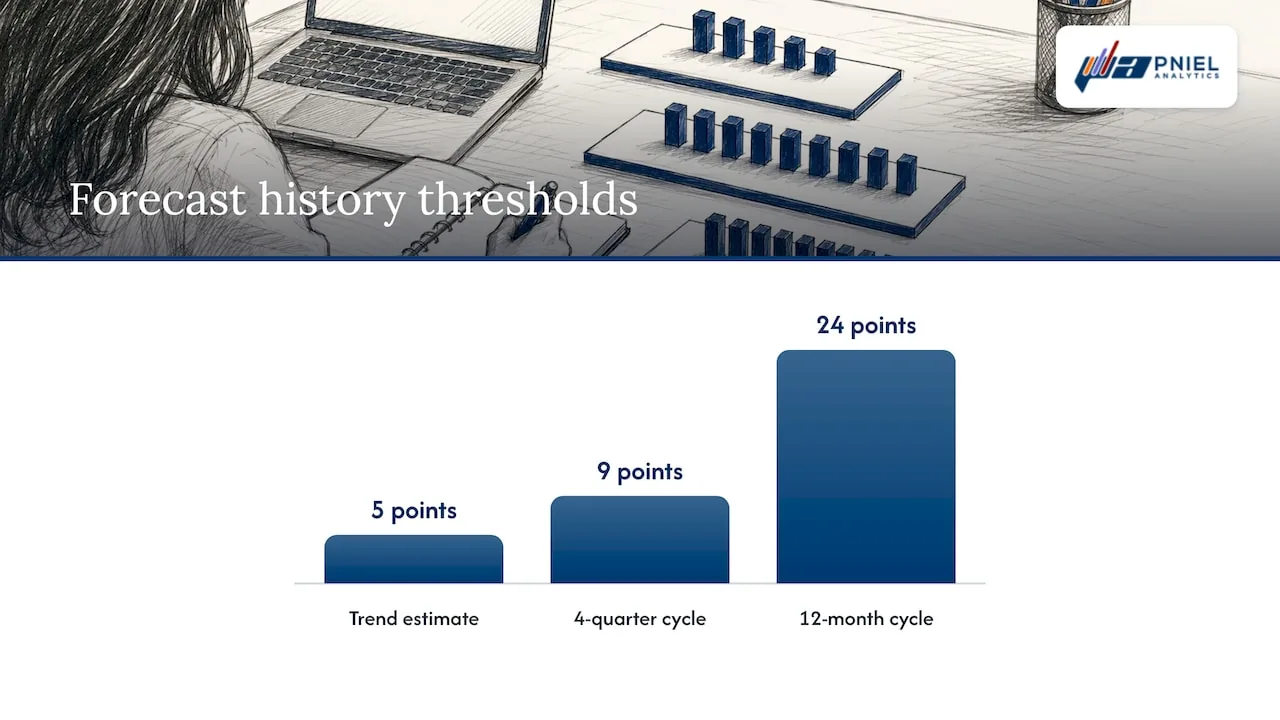
That has a plain consequence for finance and operations teams. If you have 14 months of history, Tableau cannot confirm a yearly pattern. The forecast will either drop seasonality or be less reliable. Know your history length before you promise a seasonal view.
When the view has too little data, Tableau tries a finer time grain. It forecasts there and then rolls the result back up to the grain of your chart. That can help, but it can also surprise you. A monthly chart may be forecast from weekly data without you asking.
Create a forecast in Tableau, step by step
- Connect to your data and build a line chart. Put a continuous date (for example, month of order date) on Columns and a measure (for example, SUM of net revenue) on Rows.
- Right-click the view and choose Forecast > Show Forecast. You can also use Analysis > Forecast > Show Forecast.
- Look at the shaded band. It is the prediction interval around the forecast line.
- Open Forecast > Forecast Options to change length, source data and model.
- Right-click the measure and open Forecast Result to see quality, precision and interval values.
- Add a note on the dashboard that says which model, interval and period range you used.
If you want to see how other teams tie forecasts to performance management, there are sales and revenue examples that show how operational measures are tracked against targets.
Forecast Options: the settings that change the answer
The defaults are sensible. Still, four groups of settings decide whether the forecast is useful. All of them are described on Tableau’s Forecast Options dialog page.
Forecast length
You have three choices. Automatic lets Tableau decide from the data. Exactly extends the forecast by a set number of units, such as six months. Until extends it to a chosen point in the future, such as the end of the fiscal year.
Use Exactly when a leader asks for “the next six months.” Use Until when the target is a fiscal year end. Both give the same line type, but Until stays correct as new data arrives only if you update the end point, so note it in your handover.
Source data
Three settings sit here:
- Aggregate by sets the time grain of the series. The default, Automatic, usually matches your chart.
- Ignore last drops a number of periods at the end of the actual data from the model. Use it for a partial current month. A half-finished month looks like a sudden drop, and the model will treat it as one.
- Fill in missing values with zeros treats missing periods as zero. Use it only when a missing period truly means no activity.
Model
Automatic is the default. Automatic without seasonality is useful when you know the pattern is not seasonal. Custom lets you set trend and season to None, Additive or Multiplicative.
Tableau runs up to eight exponential smoothing models and picks the one that produces the highest quality forecast. It optimizes the smoothing parameters of each model first. The book Statistical Tableau makes the same point: “forecasting” covers many methods, and the built-in Analytics pane uses exponential smoothing.
Prediction interval
The interval can be 90, 95 or 99 percent, or a custom value. A higher level gives a wider band. Wider bands are more honest for volatile measures such as monthly grant receipts. Narrow bands look confident, but they can mislead.
Check accuracy and uncertainty before you share it
A forecast line without a check is a guess with a chart around it. Right-click the measure, choose Forecast Result, and pick from the list on the forecast field results page:
| Result | What it tells you |
|---|---|
| Actual & Forecast | The default combined line |
| Trend | The trend component only |
| Precision | Distance of the interval from the forecast value |
| Precision % | Precision as a percentage of the forecast value |
| Quality | Scaled MASE on a 0 to 100 scale |
| Upper and Lower Prediction Interval | The edges of the shaded band |
| Indicator | Whether each mark is actual or forecast |
Quality is calculated as 100 * MAX(1 - MASE, 0). MASE compares the forecast error with the error of a naive forecast. A quality score of 0 means the model is no better than the naive forecast. That is a clear signal to stop and rethink.
A simple review routine
- Put Quality on a text table next to the chart. If it is near 0, do not present the line as a plan.
- Put Precision % on a second view. A forecast whose band is a large share of the value is a range, not a number. Present it as a range.
- Hold back the last few months. Use Ignore last to trim them, forecast, then compare the forecast with what actually happened. This is a simple back-test you can run in minutes.
- Re-run the check each time the data refreshes.
Why forecasts fail, and how to fix them
Tableau’s forecasting errors page names the common causes. Most are data problems.
Zero and negative values
A multiplicative model cannot be computed when the measure has values at or below zero. It also fails when some points are very close to zero compared with the rest. Tableau also does not allow a model with multiplicative trend and additive season, because it is numerically unstable. If your measure includes credits, refunds or net adjustments, use an additive model, or forecast gross and adjustments as separate series.
Too many rows
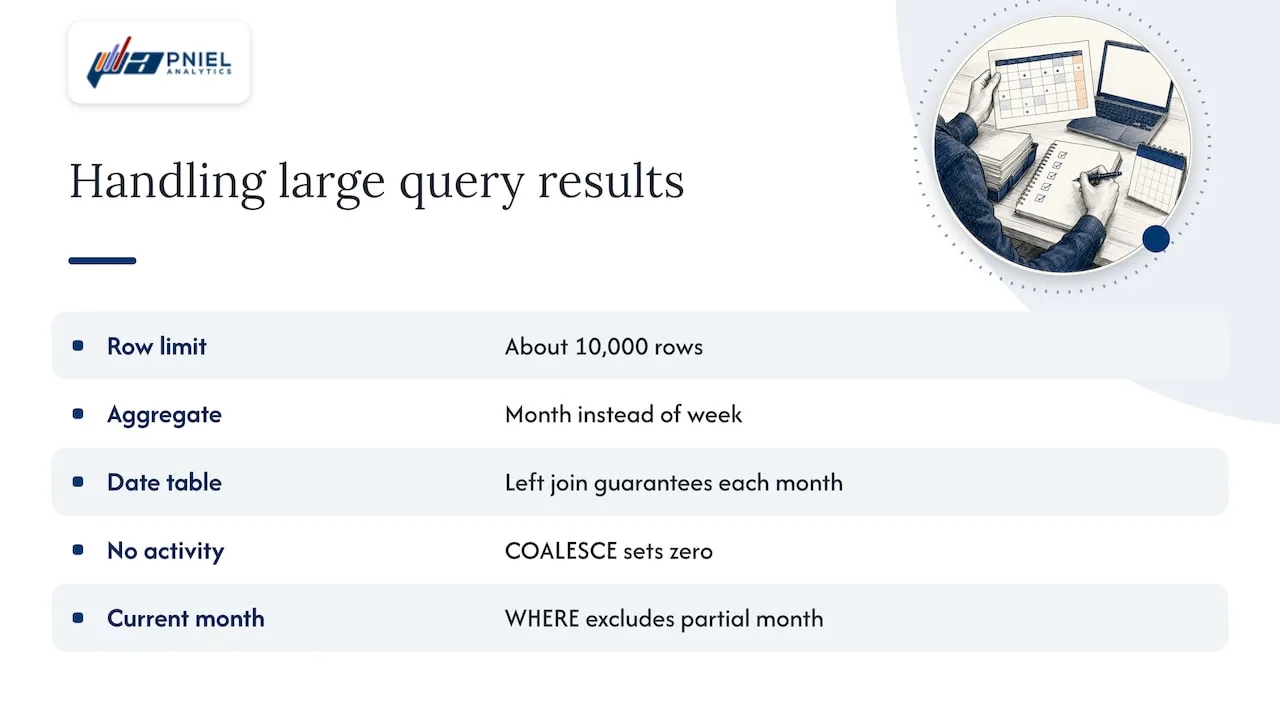
Forecasting fails when the query result is too large. The documented limit is about 10,000 rows. The fix is to aggregate at a higher level, such as month instead of week, or to filter the data.
This is where a SQL-first approach pays off. Instead of sending transaction-level rows to Tableau and aggregating there, you can build a monthly summary in the database. A pattern we use often looks like this:
SELECT
  DATE_TRUNC('month', d.calendar_date) AS month_start,
  COALESCE(SUM(f.net_amount), 0)       AS net_revenue
FROM dim_date d
LEFT JOIN fact_invoice f
  ON f.invoice_date = d.calendar_date
WHERE d.calendar_date >= '2022-01-01'
  AND d.calendar_date <  DATE_TRUNC('month', CURRENT_DATE)
GROUP BY 1
ORDER BY 1;
Three things happen here. A date table with a left join guarantees a row for every month, so there are no silent gaps. The COALESCE sets true no-activity months to zero on purpose. The WHERE clause excludes the current partial month, so the model never sees a half-month as a collapse.
Gaps and irregular dates
Missing periods distort seasonality. If a branch did not report in March, the model sees a dip. Decide whether the gap is zero or unknown. Zero can be filled. Unknown should be estimated or left out, and documented.
One series hiding many
A total across regions or programs can hide opposite trends. Forecast at the level where decisions are made. A finance team may need revenue by business unit. A program office may need caseload by county. Build the view at that grain and check quality for each series.
Forecasts for year-to-date and partial periods
Leaders often ask for a year-to-date total plus a projected year end, or a quarterly bar chart. The built-in forecast works on a time series, so the usual approach is to forecast the monthly series, then sum actuals plus forecast months for the year. Keep actual and forecast separate in the dashboard. Use the Indicator result to color them differently.
For quarterly bars, set Aggregate by to quarter only when you have enough quarters. As noted above, a four-quarter cycle needs at least nine points. If you have fewer, forecast monthly and roll up to quarters.
Tableau has also added time-based forecasting to Tableau Pulse for partial periods in its Tableau+ edition of Tableau Cloud. Check Tableau’s current release notes to see whether it fits your license.
For demand forecasting models beyond exponential smoothing, see our advanced analytics work.
Tableau predictive analytics beyond the Forecast button
The Forecast button handles one measure over time. Many questions need more than that. Which customers will churn? Which grant applications will be approved? Which machines will fail?
Tableau’s predictive modeling functions work in table calculations. They support linear regression, regularized linear regression (ridge) and Gaussian process regression. Two functions help you read the results:
- MODEL_QUANTILE returns a target value at a chosen quantile within the probable range.
- MODEL_PERCENTILE returns the probability that the expected value is at or below the observed mark.
A few rules apply:
- Gaussian process regression takes one ordered dimensional predictor and any number of unordered dimensional predictors. It does not accept measures as predictors.
- Ridge regression uses L2 regularization with a default lambda of 0.5. You can edit it. A low lambda may fit the past well and generalize poorly. A high lambda may flatten the fit to a constant.
- For time-series data, Tableau’s guidance on regularization and augmentation is to consider Gaussian process regression by setting model=gp.
When the question has many drivers, scoring individual records, or needs a model trained outside Tableau, the usual setup is to build the model in a statistical tool and bring the scores back into Tableau as a data source. The dashboard then shows the result in a form leaders can use. That is where our advanced and predictive analytics work fits.
Where teams use Tableau forecasting
Forecasting is popular because people already know it. The author of Statistical Tableau notes that forecasts appear across finance, banking, economics, healthcare, retail sales and supply chain. Here are concrete uses for the teams we serve:
- Finance and FP&A: monthly net revenue and operating expense against budget, with a prediction band for the rest of the fiscal year.
- Operations: weekly orders shipped, or units produced per line, to plan staffing and materials.
- Healthcare teams: monthly patient visits or readmission counts, to plan capacity.
- Non-profits: monthly donations by campaign, so development staff see whether the year is on track.
- Schools: enrollment by term, to plan sections and staffing.
- Banks: monthly loan applications or call volume, for branch and service planning.
- Government agencies: program caseloads, permit volume or service requests, for budget and staffing reports.
Each of these is one measure over time, so the built-in forecast is a good first step. Each also has the same data risks: partial periods, gaps and mixed grains.
Perspective: fix the data before you forecast
When a forecast looks wrong, people usually blame the model. We look at the data first.
Our approach is SQL-first. We fix slow or wrong dashboards at the data layer before we redesign any visuals. A forecast is a good test of that rule. It shows every flaw in the series: a missing month, a duplicated invoice, a partial period, a refund that turns a measure negative.
Our recommendation is simple. Before you turn on a forecast, build one clean monthly table with a row for every period. Decide what a zero means. Exclude the current partial month. Then forecast. Show the quality score and the prediction band on the same dashboard, so leaders see a range and not a promise.
We also recommend that the team that builds the dashboard maintains it. Forecast settings drift as data changes. Someone has to re-check them every refresh.
Frederick Soh
Work with Pniel Analytics on forecasting
Pniel Analytics is a Tableau and Power BI consulting firm in Newark, Delaware. We serve clients across the US, including government agencies and private-sector finance, operations and program teams. Tableau is our core platform. We also deliver in Power BI.
Our engagements typically run 4 to 6 weeks. The same team builds and maintains the work. We start with the data pipeline, then build the dashboard around how your leaders decide. If you need forecast views you can trust, see our Tableau consulting services or our overview of BI and dashboard development.
If your forecasts depend on messy source data, our data strategy and governance work covers the definitions and controls that keep the numbers consistent. To start, book a free assessment through our site.
FAQ
What model does Tableau use for forecasting?
Tableau uses exponential smoothing. It picks the best of up to eight models, based on forecast quality, after optimizing each model’s smoothing parameters. You can leave this on Automatic, turn off seasonality, or set trend and season yourself.
How do I check Tableau forecast accuracy?
Right-click the measure and open Forecast Result. Use Quality, which is a scaled MASE from 0 to 100, and Precision %, which shows the interval width as a share of the forecast. You can also hold out recent periods with Ignore last and compare the forecast with what happened.
Why does Tableau say it cannot forecast my data?
The usual causes are too few data points, a measure with zero or negative values under a multiplicative model, or a query that returns too many rows. The limit is about 10,000 rows. Aggregate to a higher level, such as month, or filter the data, and try again.
Can Tableau do more than time series forecasting?
Yes. Predictive modeling functions in table calculations support linear, ridge and Gaussian process regression. For scoring individual customers or cases, many teams build a model outside Tableau and bring the results in.
Sources
- Creating a Forecast - Tableau
- How Forecasting Works in Tableau
- Forecast Options Dialog Box - Tableau
- Forecast Field Results - Tableau
- Resolving Forecasting Errors - Tableau
- How Predictive Modeling Functions Work in Tableau
- Regularization and Augmentation in Predictive Modeling
- Forecasting in Tableau, Statistical Tableau (O’Reilly)
This article is for general informational purposes and reflects Pniel Analytics’ experience delivering BI and analytics work. It is not legal, financial, or compliance advice. For guidance specific to your data environment, contact us at fsoh@pnielanalytics.com.