
Your Power BI report is slow, or its numbers are stale, and someone suggests switching the storage mode. That switch can fix the problem or make it worse. The right answer depends on how big your data is, how fresh it must be, and how well your source database handles repeated queries.
In short: use Import by default. Use DirectQuery when the data is too large to load or refresh, or when you truly need near-real-time results. Use a composite model with Dual tables when one report needs both. This guide explains each choice in plain terms for operations, finance and program leaders.
TL;DR
- Import copies data into Power BI’s in-memory model. Visuals read that copy, so reports are usually fast, but the data is only as current as the last refresh.
- DirectQuery stores no data. Each visual sends queries to the source, so speed depends on the source, the network and the gateway.
- Microsoft recommends Import as the default and DirectQuery only when size, freshness, security or architecture require it.
- Composite models mix storage modes in one model. Dual mode lets a dimension table serve both Import and DirectQuery queries.
- Many slow DirectQuery reports are really slow-source problems. Fixing the SQL layer often helps more than changing visuals.
Turn your data into decisions
We build Tableau and Power BI dashboards and the data models behind them. Book a free 30-minute analytics assessment and we'll map the fastest path for your team.
Book a Free Analytics AssessmentOn this page
- How Import and DirectQuery work
- Speed and responsiveness
- Data freshness and refresh
- Data size and model limits
- Import vs DirectQuery at a glance
- When to use Import
- When to use DirectQuery
- Composite models and Dual mode
- A practical way to decide
- Fix the data layer first
- Does this apply to Tableau?
- How Pniel Analytics can help
- Our perspective on storage modes
- FAQ
- Sources
How Import and DirectQuery work
Import copies the data you select into the Power BI semantic model. Every visual then queries that cached copy. Microsoft describes Import as the default choice because it uses Power BI’s high-performance in-memory engine and offers the richest set of features.
DirectQuery works differently. The model holds only metadata: table names, columns and relationships. No data is imported at load time. When a user opens a page or clicks a slicer, each visual sends one or more queries to the source database.
That difference drives everything else. With Import, the report and the source are separate. With DirectQuery, every click is a live request to your database.
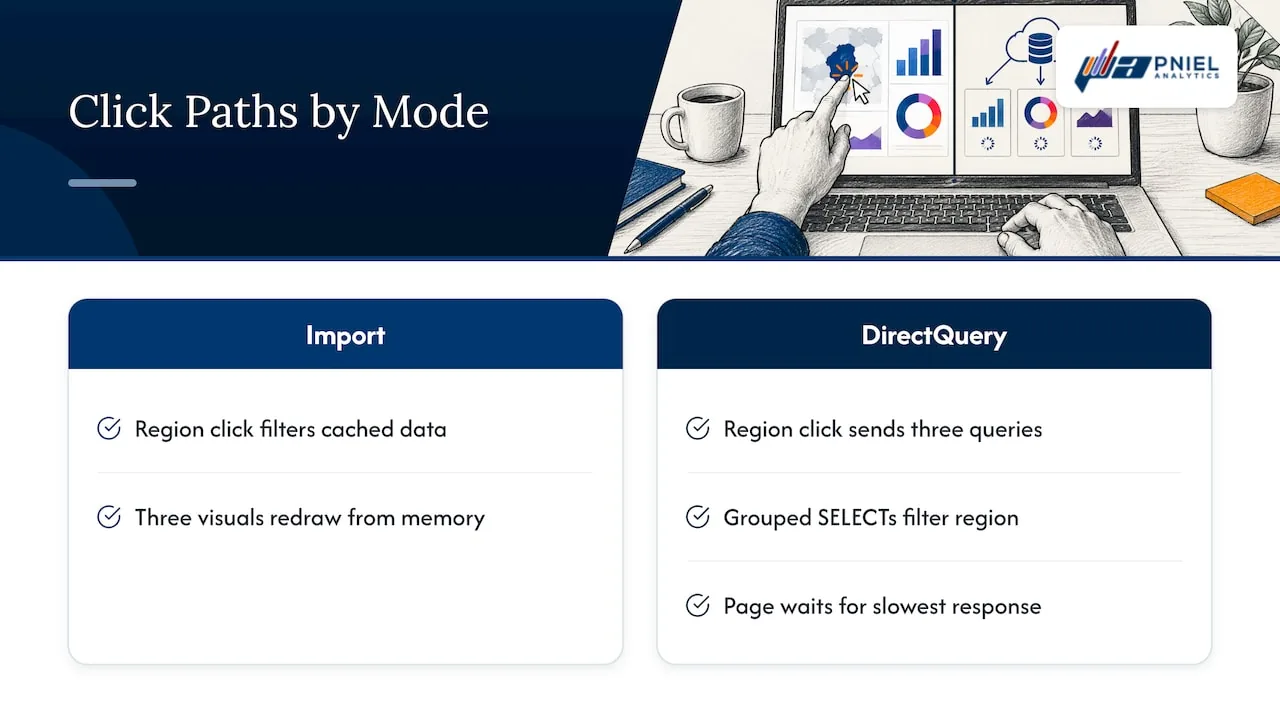
What a click does in each mode
Take a finance dashboard with a monthly revenue chart, a cost-center table and a region slicer.
In Import mode, you pick “Northeast” in the slicer. Power BI filters the cached data and redraws all three visuals from memory.
In DirectQuery mode, the same click sends three queries to the source. Each one runs a grouped SELECT with a filter on region. The page finishes when the slowest query returns.
The path from visual to source also affects how quickly a page responds and how current it is. Teams that want outside help with this can look at Power BI analytics services for more on how visuals reach their data.
Speed and responsiveness
Import is normally faster. Microsoft’s modeling guidance and independent technical write-ups agree that cached data filters quickly, while DirectQuery can add seconds of delay after a filter change.
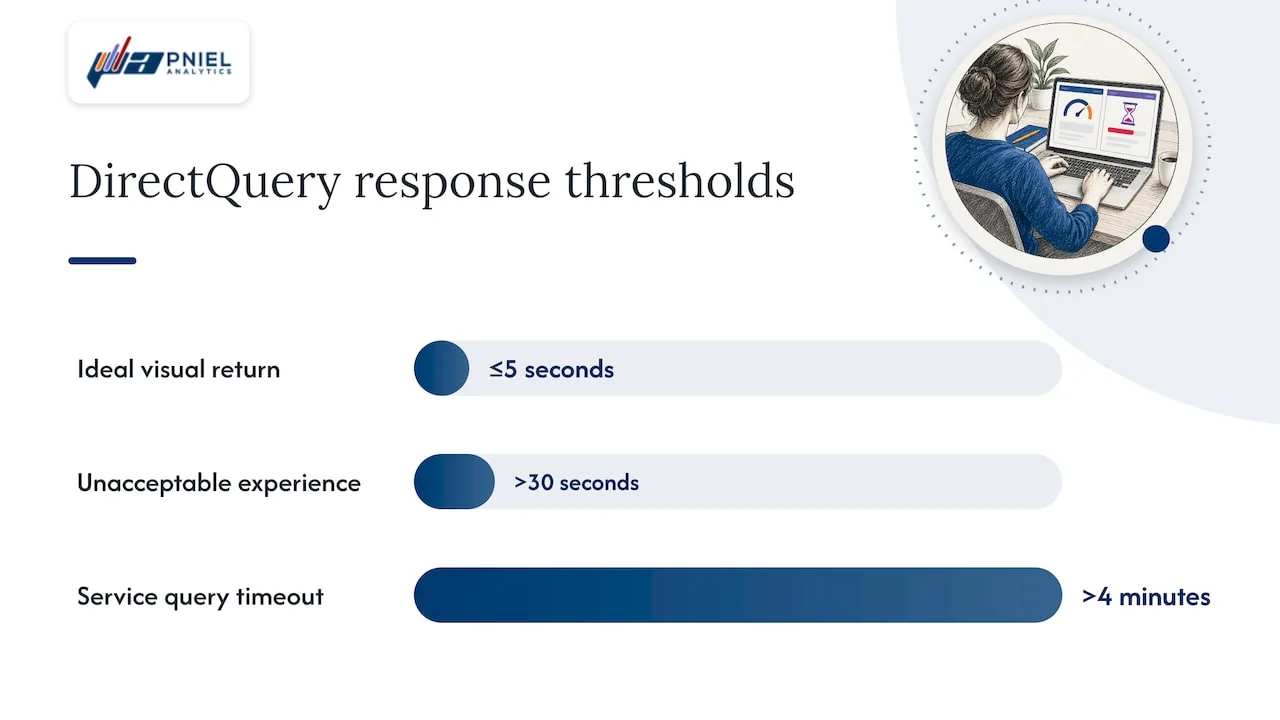
Microsoft gives clear targets for DirectQuery. A visual should ideally return in five seconds or less. More than 30 seconds is an unacceptably poor experience. A query that takes longer than four minutes times out in the Power BI service.
Use those numbers as a test. Open your slowest page and time each visual. If several run past 30 seconds, executives will stop using the report.
What slows DirectQuery down
Three things matter most:
- The source database. A transactional system under heavy load will answer analytic queries slowly.
- The query shape. A visual that scans a 200-million-row table with no filter will always be slow.
- The network path. Gateways and distance add overhead to every request.
This is where our SQL-first approach applies. We fix slow or wrong dashboards at the data layer before redesigning any visuals. A pre-aggregated view, a proper index on the date key, or a cleaner join often cuts query time more than any visual change.
Data freshness and refresh
Import data is only as current as the latest refresh. Microsoft’s service guidance says so directly, and notes that a full refresh removes and reloads all table data, which can use substantial time and resources.
Refresh frequency has limits. Scheduled refresh is capped at eight times per day on shared capacity and 48 times per day on Premium capacity. Check your own capacity and the current limits before you plan a schedule.
DirectQuery has no scheduled data refresh. Users see current source data after a requery. That is the main reason teams choose it.
How fresh does it need to be?
Most leadership reports do not need live data. A weekly program scorecard, a monthly close dashboard and a quarterly budget-versus-actual view all work well on a nightly refresh.
Live data matters in a few places:
- A call-center queue where supervisors act within minutes.
- A warehouse dispatch board.
- A fraud or claims queue that staff work from.
Before choosing DirectQuery for freshness, ask who acts on the number and how fast. If the answer is “in the next morning’s meeting,” Import with a scheduled refresh is enough.
Data size and model limits
Size is the second reason to choose DirectQuery. Microsoft says DirectQuery can support very large semantic models where importing all the data is not feasible, and that the 1-GB semantic-model limit does not apply to it in Power BI Desktop.
Import compresses each column, so many models that look large in the source fit comfortably in memory. Test the real size before you assume you need DirectQuery. Removing unused columns and trimming history often shrinks a model a great deal.
DirectQuery limits to know
DirectQuery has feature limits. The automatic date/time hierarchy is unavailable. Tables or matrices that return more than 500 rows have a 125-column limit.
The practical effect: you need a proper date table in your source. If your source has no calendar table, we add one in SQL. That is a small change that also helps every other report.
Import vs DirectQuery at a glance
| Factor | Import | DirectQuery |
|---|---|---|
| Where data lives | Cached in the Power BI model | In the source database |
| Typical speed | Fast, in-memory | Depends on source, network and gateway |
| Freshness | Last refresh | Current after requery |
| Scheduled refresh | Required | Not needed for source data |
| Very large data | Limited by model size | Suited to it |
| Modeling features | Full | Some limits |
| Load on source | Only during refresh | Every visual interaction |
When to use Import
Choose Import when most of these are true:
- The data fits in the model after you remove unused columns.
- A daily or several-times-daily refresh meets the business need.
- Users expect fast filtering and drill-down.
- You want full DAX and Power Query features.
- The source system should not take on dashboard traffic.
This covers most executive dashboards, finance reporting and program scorecards. Microsoft also states that teams should move beyond Import only when constraints such as latency, size, governance, security or architecture require it.
When to use DirectQuery
Microsoft names two principal reasons: data volumes too large to load or practically refresh, and near-real-time needs beyond what scheduled refresh can deliver.
DirectQuery also needs a source that can take the load. Before you commit, check these items:
- The source is on the list of sources DirectQuery supports.
- The key tables have indexes on the columns used for joins and filters.
- The database team agrees to the extra query traffic.
- The gateway, if needed, is sized and monitored.
- Report pages have few visuals each, so fewer queries fire per click.
Independent guidance from a university technology group takes a similar view. DirectQuery should be reserved for very large or frequently changing data, because ordinary interactions can feel slower than cached reports.
Composite models and Dual mode
You do not have to pick one mode for the whole model. A composite model has tables in more than one storage mode.
A common pattern is a large fact table in DirectQuery with small lookup tables, such as region, product or department, in Import. The facts stay live and the slicers stay quick.
What Dual mode does
Dual storage mode makes a table both Import and DirectQuery, so Power BI picks the more efficient path for each query.
Here is how it plays out. Suppose a Department dimension is Dual and a Transactions fact is DirectQuery from the same database. A slicer that lists departments reads the cache. A chart of spend by department sends one native query that joins both tables at the source, and the relationship stays regular.
Storage mode by table type
Microsoft’s composite-model guidance gives a clear split:
| Table type | Suggested mode |
|---|---|
| Large or near-real-time fact table | DirectQuery |
| Dimension queried with a DirectQuery fact from the same source | Dual |
| Table that does not filter or group DirectQuery facts | Import |
| Source that DirectQuery does not support | Import |
This comes from Microsoft’s composite-model guidance, which also describes hybrid designs: the latest data in DirectQuery and imported history behind it.
Composite model cautions
Composite models add complexity. Relationships that cross source groups can become limited relationships. Groupings from non-DirectQuery tables may be sent to the source as materialized subqueries. The native queries can be inefficient, and results can be unexpected when relationship values do not match.
To use them well:
- Keep relationships and source groups simple.
- Keep cached tables in sync with the source.
- Preserve data integrity, so keys match on both sides.
- Index the source tables DirectQuery will hit.
A practical way to decide
Work through these steps in order.
- Start with Import. Build the model, remove unused columns, and measure its size.
- Set the freshness requirement. Write down who acts on each number and how soon.
- Try a faster refresh first. If the need is hourly rather than live, a more frequent schedule may be enough.
- Use DirectQuery for the large or live table only. Keep everything else imported.
- Mark shared dimensions Dual when they come from the same source as the DirectQuery fact.
- Time every visual. Use the five-second and 30-second marks as pass or fail.
Example: a program reporting dashboard
A program office tracks open cases, days to close and backlog by office. The case table grows daily, but managers review it each morning.
Import fits. A nightly refresh loads a SQL view that already counts cases by office and status. Pages open fast and the source system is untouched during the workday.
Now suppose supervisors need to see new cases within minutes. We would keep the history imported, move only the current-day slice to DirectQuery, and keep the office and status dimensions Dual. The live piece stays small, so the source query stays quick.
Example: a finance close dashboard
FP&A teams often want a P&L, budget variance and aging receivables in one place. The general ledger is large, but the reporting grain is monthly.
A SQL layer that summarizes the ledger by account, cost center and month cuts the row count sharply. The summarized table imports easily. Detail drill-through can use a separate DirectQuery page limited to one cost center at a time.
Fix the data layer first
Storage mode is often blamed for problems that start in the data. We see the same causes again and again:
- Joins across wide tables with no supporting index.
- Calculations done in the visual that belong in SQL.
- Duplicate keys that inflate totals and make numbers disagree between reports.
- No date table, which pushes date logic into every measure.
- Views that return every column when a report uses six.
Our SQL-first approach addresses these before we touch a chart. Once the data layer is clean, many reports run well in Import. Reports that still need DirectQuery run better too.
Does this apply to Tableau?
Tableau has the same basic choice, with different names: an extract holds a cached copy, and a live connection queries the source. The same logic applies. Use extracts for speed and predictable load, and live connections when freshness or size demands it. Tableau is our core platform, and we deliver in Power BI as well, so we can advise on either.
How Pniel Analytics can help
If your reports are slow, stale or disagree with each other, we start at the data layer. We diagnose bottlenecks, build reliable data flows and then deliver dashboards shaped around how your leaders decide. Our engagements typically run 4 to 6 weeks. The same team builds and maintains the work.
We work with finance, operations and program teams at mid-size companies, nonprofits and government agencies. We are registered for government work on SAM.gov.
See our Power BI consulting and Tableau consulting pages, or book a free assessment through Pniel Analytics.
Our perspective on storage modes
Most teams reach for DirectQuery because they want “real time.” We suggest asking one more question first: who will act on the number in the next hour? If nobody will, Import with a good refresh schedule is the better build.
When live data is a real need, we keep the live part small. One fact table in DirectQuery, shared dimensions in Dual, everything else imported. That keeps pages quick and keeps load off the source.
Our recommendation is to fix the SQL first. A summarized view and a proper date table solve more complaints than any storage mode switch. After that, pick the mode the business need requires, and have the team that builds the model also maintain it.
Frederick Soh
FAQ
Is DirectQuery faster than Import?
No. Import is normally faster because visuals read an in-memory cache. DirectQuery sends queries to the source with each interaction, so speed depends on the source, the network and the gateway.
Can I use both Import and DirectQuery in one report?
Yes. A composite model lets tables use different storage modes. A typical design keeps a large fact table in DirectQuery and small dimensions in Import or Dual.
What is Dual mode in Power BI?
Dual mode makes a table work as both an imported cache and a DirectQuery table. Power BI chooses the better path for each query. It suits dimension tables that join with a DirectQuery fact from the same source.
How often can Import data refresh?
Microsoft’s guidance lists up to eight scheduled refreshes per day on shared capacity and 48 on Premium capacity. Check the current limits for your license. If you need fresher data than that, consider DirectQuery for the table that needs it.
Should I switch an existing report from DirectQuery to Import?
Often, yes, if the data fits and users can accept a refresh schedule. Check the model size and freshness need first. We can review the report and the SQL behind it and recommend the change.
Sources
- DirectQuery in Power BI: When to Use, Limitations, Alternatives (Microsoft Learn)
- Semantic model modes in the Power BI service (Microsoft Learn)
- Use DirectQuery in Power BI Desktop (Microsoft Learn)
- Table storage mode in Power BI semantic models (Microsoft Learn)
- Composite model guidance in Power BI Desktop (Microsoft Learn)
- Power BI connection modes (Davidson Technology & Innovation)
This article is for general informational purposes and reflects Pniel Analytics’ experience delivering BI and analytics work. It is not legal, financial, or compliance advice. For guidance specific to your data environment, contact us at fsoh@pnielanalytics.com.