
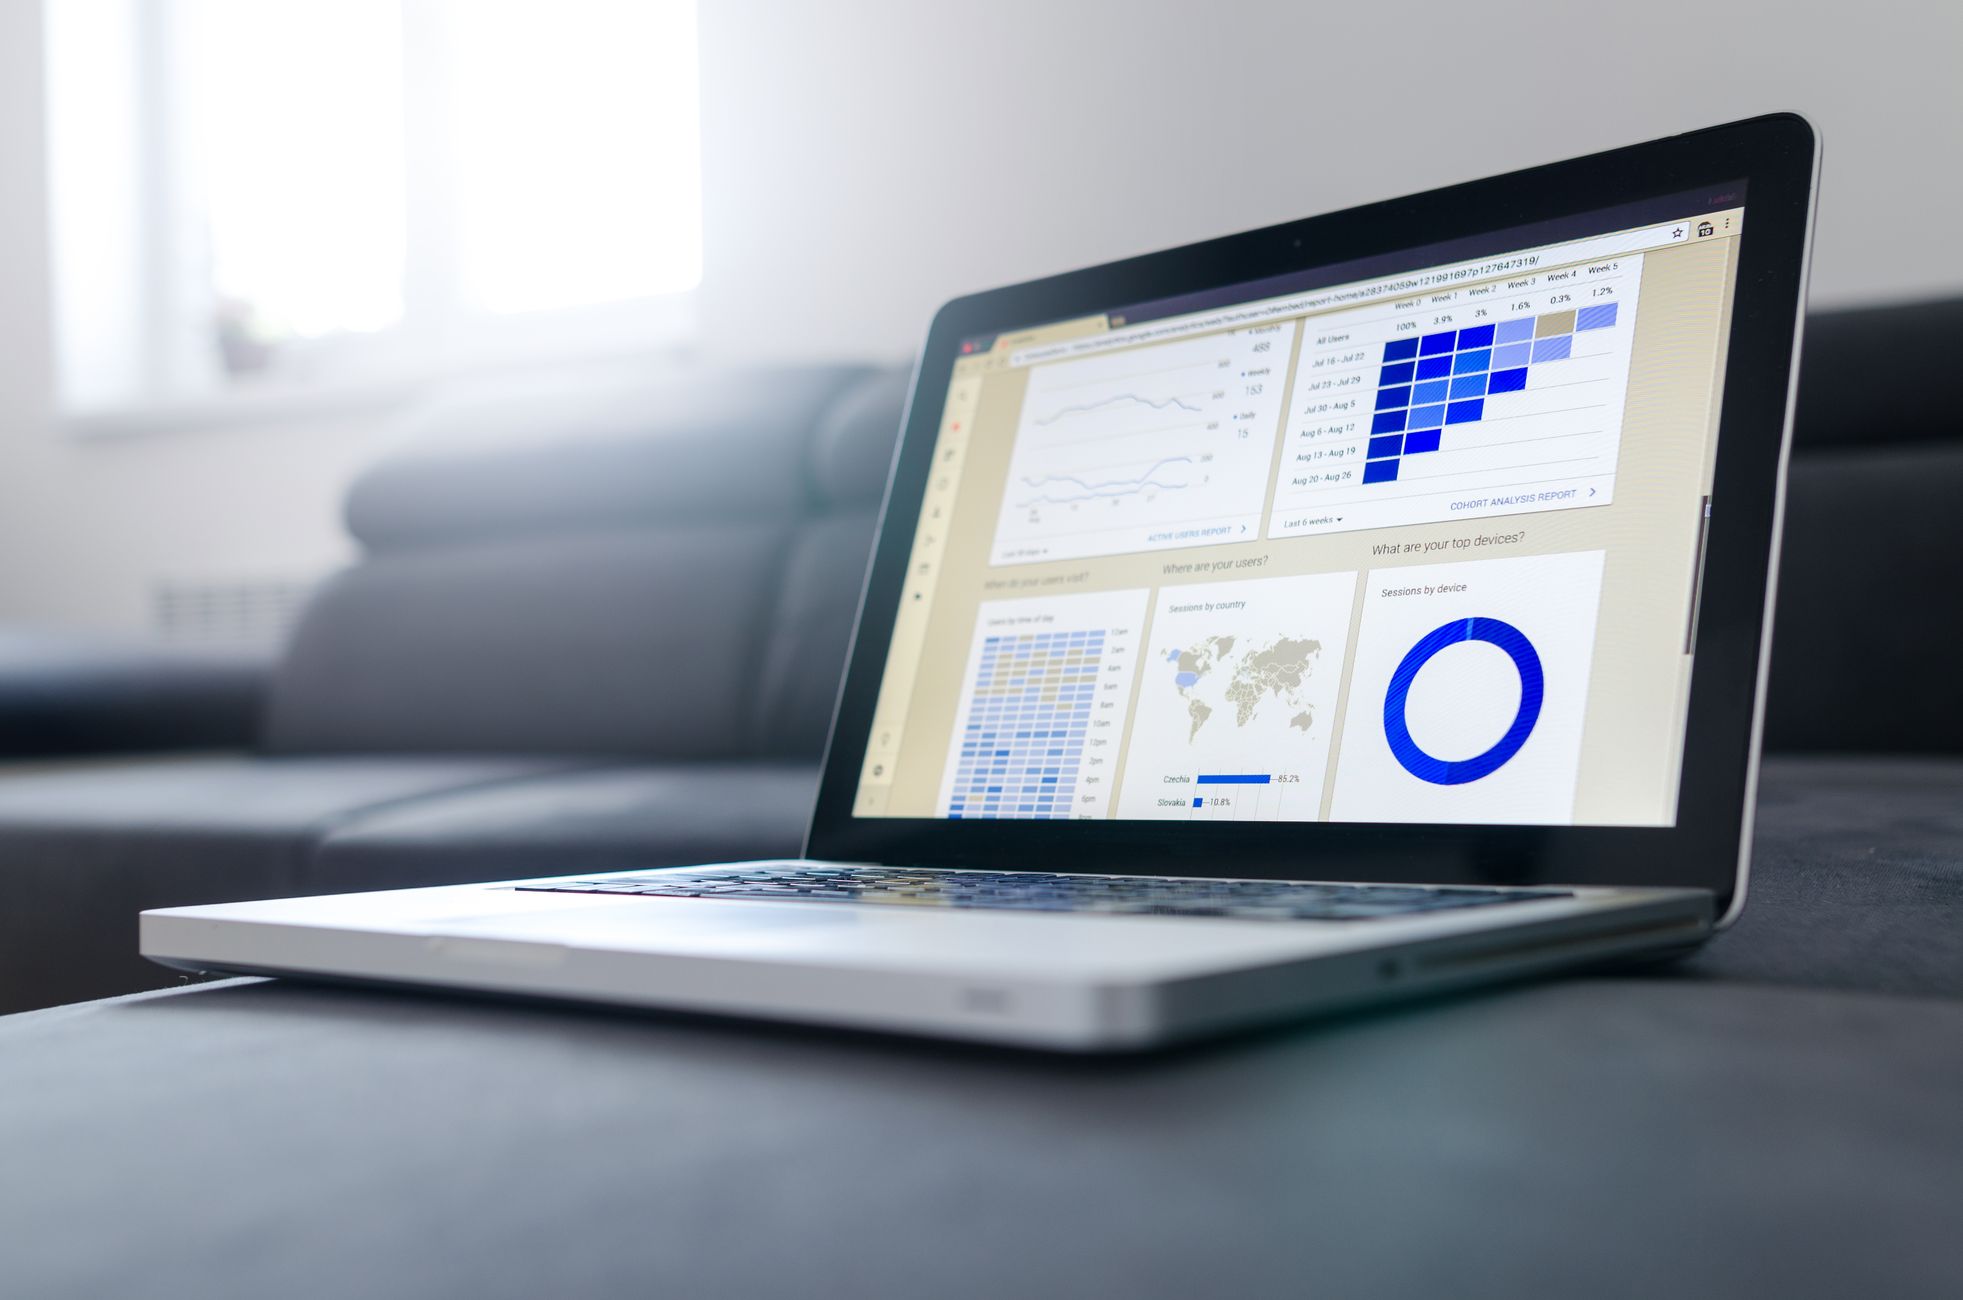
Most companies we talk to already have dashboards. Somebody built them, maybe a contractor or maybe a smart analyst who has since moved on. They're in Power BI or Tableau, they refresh every night, and hardly anyone looks at them.
When we ask why, we hear the same few answers. "The numbers don't match finance." "It takes too long to load." "I don't know what I'm supposed to do with it." Nobody ever says the charts look bad. The trouble is underneath: the data, and whether anyone agreed on what the report was for.
The decision comes first
A dashboard should help one person make a decision they make often. A clinic manager deciding how to staff next week. A plant supervisor deciding which line to check first. A county program lead deciding where to send outreach teams.
If we can't name that person and that decision, we don't start building.
That can make the first meeting feel slow. We ask questions that seem to have nothing to do with software: What did you decide last Monday? What did you look at? What do you wish you'd known?
Those answers tell us which ten numbers matter out of the hundreds a system can produce.
The numbers have to agree
Show a revenue figure that doesn't match the monthly finance packet, and people go back to spreadsheets. Most don't come back.
So a lot of our work happens before anyone sees a chart. We sit down with the business and agree on what each number means (what counts as an "active customer," or when an order is "closed"), write those definitions down, and then write the SQL. It's boring work. It's also the reason people still trust a dashboard a year after it goes live.
Slow reports don't get used
If a report takes forty seconds to load, people stop opening it. The fix is rarely a bigger server. More often it's a cleaner data model, fewer visuals on each page, and pulling in only the data the page needs. We treat load time like accuracy: if it's slow, it's not finished.
People need to know how to use it
A good report can still fail if the team doesn't know how to read it or doesn't feel they're allowed to question it. Every project includes training. Sometimes that's a short walkthrough for managers. Sometimes it's several weeks with an in-house analyst so they can maintain and extend the work after we leave.
We'd rather you didn't need us for the next change.
Where prediction fits
Forecasting and predictive models make sense once the basics are working. A demand forecast built on inconsistent sales data will be wrong, and it will be wrong with a lot of confidence. When the foundation is solid, a simple model that flags likely late payments or next month's patient volume can save real time. We start with the plainest method that works and add complexity only when it earns its keep.
Who we are
Pniel Analytics is a small, minority-owned firm based in Newark, Delaware. The people who scope your project are the same people who build it, so nothing gets lost in handoffs and you'll always know who to call.
If you have a dashboard nobody opens, we'd like to see it. Bring the report and tell us about the decision it was supposed to help with. We'll tell you honestly whether it needs to be rebuilt, adjusted or retired.