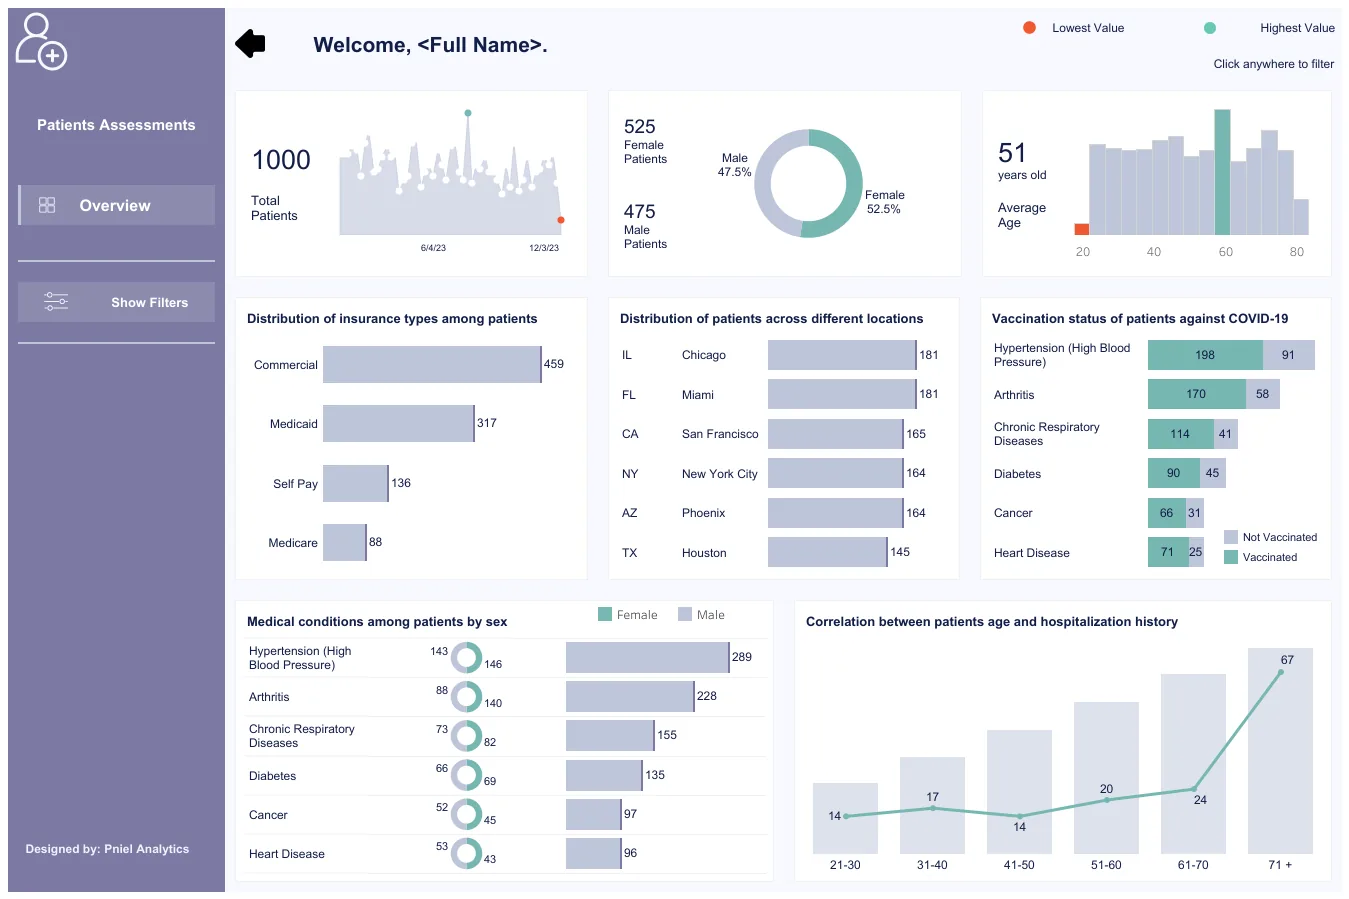
Your dashboard has forty tiles, three teams disagree on the revenue number, and the monthly review ends without a decision. That is usually a framework problem, not a chart problem. A KPI framework ties a small set of measures to your goals, gives each measure one owner and one definition, and feeds them from data you can trust. This guide walks through how to design one, step by step, for operations, finance and program leaders.
TL;DR
- Start from objectives, not from available data. Every KPI should trace back to a strategic or operational goal.
- Keep the set small. Industry guidance points to ten measures or fewer on a dashboard and no more than seven indicators per objective.
- Write a full definition for each KPI: formula, data source, baseline, target, refresh frequency and one named owner.
- Fix the data layer before the visuals. A wrong number in a good-looking dashboard does more harm than a plain table with a right one.
- Review on a fixed rhythm and prune KPIs that no longer drive decisions.
Turn your data into decisions
We build Tableau and Power BI dashboards and the data models behind them. Book a free 30-minute analytics assessment and we'll map the fastest path for your team.
Book a Free Analytics AssessmentOn this page
What a KPI Framework Actually Contains
People use the phrase for different things. Some mean a method for choosing measures. Others mean a goal structure such as a balanced scorecard. Others mean the dashboard. A working framework has four parts, and you need all of them:
- Objectives. What the organization or program is trying to achieve.
- KPIs. The few measures that show whether you are getting there.
- Definitions and ownership. The written rules for how each KPI is calculated and who answers for it.
- Data and reporting. The pipelines, models and dashboards that deliver the numbers on a schedule.
A metric is any number you can count. A KPI is a metric you have tied to an objective and a target. A hospital might track hundreds of metrics and have a dozen KPIs.
It says a good one is aligned, actionable, realistic and measurable. Use those four words as your first filter.
Step 1: Start With Objectives, Not Data
The most common mistake is to open the data warehouse, see what columns exist and build KPIs from them. You end up measuring what is easy.
Start with the objectives instead. Write three to five for the year. For example:
- Close the books faster each month.
- Reduce unplanned downtime on the packaging line.
- Raise the share of grant dollars spent within the award period.
- Shorten the time from permit application to decision.
Then link each objective to the plan that delivers it. The point for you is the last two stages. A KPI framework is not finished when the dashboard ships. It feeds a review that tests whether your plan is working.
If you want a structure for grouping objectives, the balanced scorecard is a common one. It groups measures by perspective, such as financial, customer, internal process and learning. We cover the build in our guide to a balanced scorecard dashboard.
Step 2: Choose Few KPIs
Every KPI you add competes for attention with the others. Choosing is mostly subtraction.
It also says ten measures or fewer are usually enough for a dashboard.
For each candidate, ask five questions.
- Is the measure reliable?
- Does it affect an organizational goal?
- Can you track its trend over time?
- Is the data easy to get?
- Do the people who will use it understand it?
Add one more of your own: if this number moved 20%, would anyone do something differently? If not, drop it. It is a metric, and it can live in a drill-down page.
Keep tiers separate
Senior leaders and process owners need different views. A CFO sees days to close. The accounting manager sees reconciliation backlog by account. Both connect, and each has an owner.
Step 3: Write a Definition for Every KPI
Two teams that both report “customer churn” often compute it differently. A framework prevents this by documenting each KPI once. It also says every KPI should trace to an objective and plausibly drive a decision.
Keep a KPI dictionary. One row per KPI. These fields cover what you need:
| Field | What to write | Example (finance) |
|---|---|---|
| Name | Plain label used everywhere | Days to close |
| Objective | The goal it supports | Close the books faster |
| Formula | Exact calculation, with inclusions and exclusions | Business days from period end to final sign-off |
| Data source | System and table | General ledger close calendar table |
| Baseline | Where you are now, with the period | Last four quarter-ends, averaged |
| Target and threshold | The goal and the level that triggers review | Target set by the controller; red when above target |
| Frequency | How often it is refreshed and reviewed, matched to how fast it can change | Weekly during close, monthly otherwise |
| Owner | One named person who can change it | Controller |
The AMCHP tool suggests an aim statement that covers what, why, who and by when. Use it for targets: “Reduce days to close from the baseline to the target by the end of fiscal Q3, owned by the controller.”
Two details matter most. The first is the exclusion rules in the formula. The second is the single owner. A KPI owned by a committee is owned by nobody.
For a finance team, the same discipline applies to the monthly cycle. See how this looks in our guide to a month-end close dashboard.
Step 4: Balance Leading and Lagging Indicators
A lagging indicator reports a result: revenue, readmission rate, grant dollars returned. By the time it moves, it is too late to change the period. A leading indicator gives an early signal: qualified leads, open work orders past due, applications awaiting review.
The Performance Excellence Network gives a sales example: cold calls, visits and qualified leads as leading indicators for revenue growth. Link them on purpose, so you can see whether the leading measure predicts the outcome.
Here are pairs from other sectors. They are illustrations of the pattern, not benchmarks:
| Sector | Leading indicator | Lagging indicator |
|---|---|---|
| Manufacturing | Preventive maintenance tasks completed on schedule | Unplanned downtime hours |
| Healthcare | Follow-up appointments scheduled before discharge | 30-day readmission rate |
| Nonprofit | Donor meetings held per fundraiser | Funds raised against annual goal |
| Government | Applications awaiting review past the service window | Average days from application to decision |
| Banking | Share of loan files complete at submission | Time to fund |
Step 5: Fix the Data Layer First
This is where many frameworks fail in practice. The design is sound on paper. Then the dashboard shows a number that does not match finance, loads in 90 seconds, or changes when someone refreshes it.
Our approach is SQL-first. When a dashboard is slow or wrong, we fix it at the data layer before we redesign any visuals. Typical causes are:
- Duplicate rows from a bad join. A one-to-many join between orders and shipments doubles revenue. The fix is to aggregate each table to the right grain before joining.
- Mixed grain. Daily targets compared with monthly actuals. The fix is a dimensional model with a date dimension and one fact table per grain.
- Definitions in the report, not the database. Each analyst rebuilds the calculation in a Tableau calculated field. The fix is to compute the KPI once in a view or modeled table, so every report reads the same logic.
- Live queries against transactional systems. Heavy dashboards slow the source system and the dashboard. The fix is a scheduled extract or a warehouse table.
A simple pattern for a KPI view looks like this: one row per period and per KPI, with columns for actual, target, prior period and owner. A dashboard reading that table needs almost no calculation, so it loads fast and every user sees the same figure.
Data quality is part of the framework, not an afterthought. Add checks for completeness, freshness and duplicates to each KPI’s source, and show the last refresh time on the dashboard. Our data quality management guide explains how to set those checks up.
Step 6: Build the Dashboard Around Decisions
Only now do you design visuals. Build for the meeting where the KPIs get used.
- Put the KPI, its target and its status in one row. A number without a target is hard to read.
- Show the trend next to the current value. A sparkline or a 13-month line is enough.
- Let users drill from the KPI to its drivers. This is what decomposition means: breaking a high-level measure into the parts that cause it, such as revenue into volume, price and mix. A top-level number tells you what happened. The breakdown tells you why.
- Show the owner and the last refresh date.
- Limit the first screen to the ten measures or fewer discussed above.
In Tableau, parameters, set actions and dashboard actions handle most drill-down needs. Power BI offers drillthrough pages and bookmarks for the same job. We build in both, with Tableau as our core platform. You can see examples on our featured dashboards page, and our KPI progress overview sample dashboard shows a KPI-to-target layout.
For the executive view specifically, see our executive dashboard examples.
Step 7: Set a Review Rhythm and Prune
A framework that nobody reviews decays. The KPI Institute treats the framework as cyclical, not a one-time project. Set the cadence when you design it:
- Weekly: a short team review of operational KPIs.
- Monthly: department review of trends and drivers.
- Quarterly: leadership review of whether the KPIs still match the strategy.
APQC also says to audit measures periodically and drop any that leaders and process owners no longer use to investigate performance or make decisions.
Keep the tone of the review constructive. If people fear a red status, they will argue with the definition instead of fixing the problem.
KPIs and OKRs: Keep Them Apart
KPIs track the health of ongoing work. OKRs (objectives and key results) set stretch goals for a period. A KPI that is red means something is wrong. An OKR that is at 70% may be on plan. If you put both on one list, the colors mean opposite things.
Run them as two lists that point at the same objectives.
How the Framework Looks by Sector
The six steps stay the same. The objectives and data sources change.
- Healthcare. Objectives center on outcomes and access. Data comes from the EHR and scheduling systems. Definitions need care, because a readmission window or a patient cohort must be written down exactly. Our healthcare KPI dashboard playbook covers this.
- Finance and FP&A. Objectives center on speed and accuracy of reporting and on forecast quality. The ERP and the general ledger are the sources. Reconciling to the ledger is the test of trust.
- Nonprofits. Objectives center on fundraising and program impact. Data sits in a CRM and in grant records. See our Catalyze Challenge impact dashboard case study.
- Government. Objectives center on service delivery and program reporting. Measures often need to follow a funder’s or legislature’s definitions, so the dictionary matters even more.
- Manufacturing, schools and banks. Plant and line data, student information systems and loan systems each need their own source mapping before KPIs can be compared across sites or branches.
Where Pniel Analytics Fits
If you have the objectives but not the time to build the data layer and dashboards, we can do that work with you. Our engagements typically run 4 to 6 weeks. The same team builds and maintains the work, so the person who wrote your KPI logic is the person you call when a number looks off.
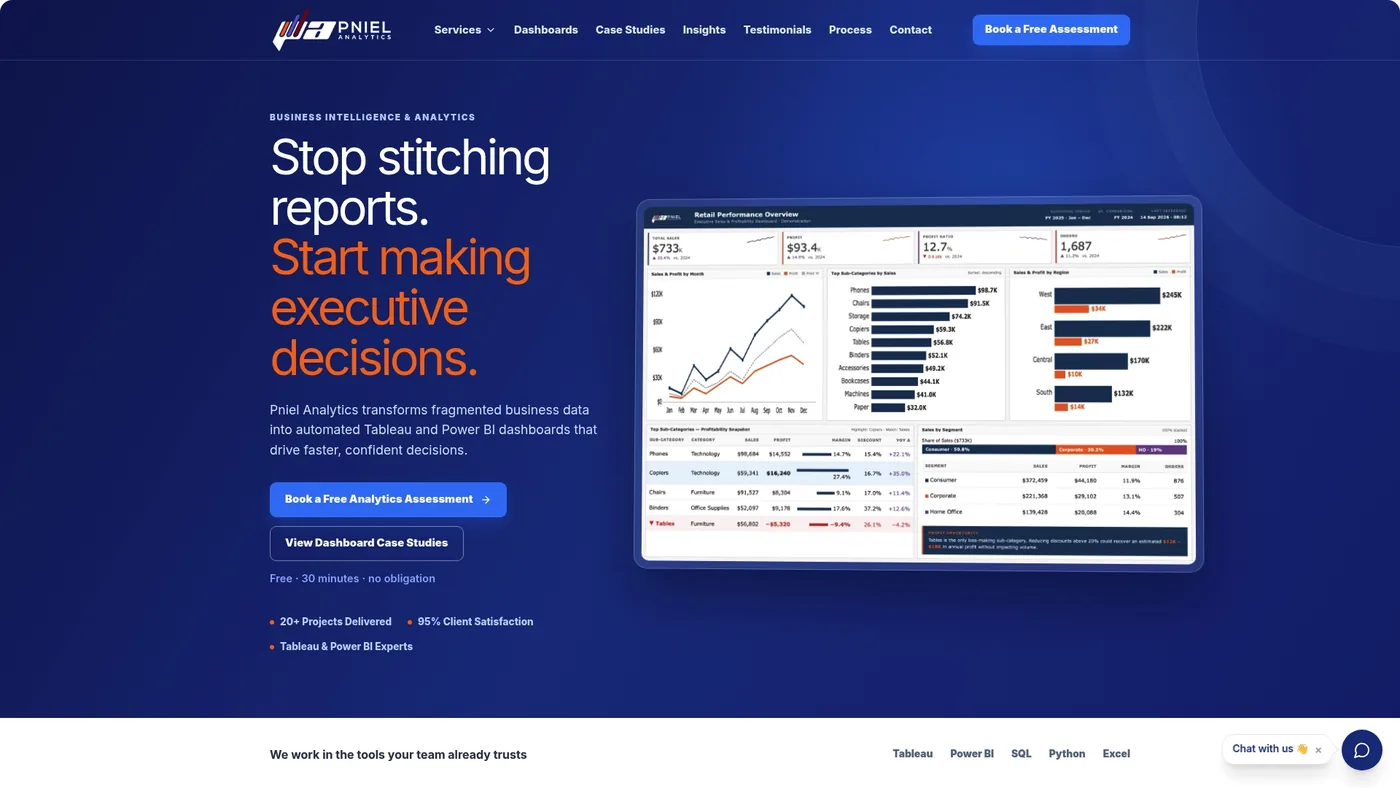
We work in Tableau and Power BI, and we start with SQL so the numbers are right before the visuals are polished. We are registered for government work on SAM.gov and build for public-sector reporting needs.
Learn more about our Data Strategy & Governance work for KPI definitions and ownership, or our Tableau consulting for the dashboards. You can also book a free assessment through our site.
Our Perspective
I recommend starting every KPI project with a one-page dictionary, before anyone opens Tableau or Power BI. Write the formula, the source table and the owner for each KPI, and get the owner to sign off.
Most disputes about dashboards are disputes about definitions. If finance and operations agree on the formula in writing, the build is quick. If they do not, no visual design will settle it.
My second recommendation is to compute each KPI once, in the database, and let every report read it. That is why we work SQL-first. When a dashboard is slow or wrong, the fix is almost always in the data model, and redesigning the charts only hides the problem.
Finally, cap the first release at a handful of KPIs. You can add more after leaders use the first set for a quarter. It is much harder to remove KPIs than to add them.
Frederick Soh
FAQ
How many KPIs should a framework have?
Keep the dashboard to ten measures or fewer. Other guides suggest four to six per balanced scorecard perspective. Start small and add only when leaders ask for a number they cannot get.
What should a KPI definition include?
Include the name, the objective it supports, the exact formula, the data source, the baseline, the target and threshold, the refresh frequency and one named owner. Store them in one shared dictionary.
What is the difference between a KPI and a metric?
A metric is any measurement. A KPI is a metric tied to an objective, with a target and an owner, that should drive a decision. A team can track many metrics and still have only a few KPIs.
How long does it take to design and build a KPI framework?
The design work, agreeing objectives and definitions, depends on how quickly your leaders decide. Our dashboard engagements typically run 4 to 6 weeks, with the same team building and maintaining the work. Contact us through our Tableau and Power BI services for scope.
Related insights
- Balanced Scorecard Dashboard: How to Design and Build One
- Dashboard Design Principles for Clear, Fast Decisions
- Executive Dashboard Examples & Template
This article is for general informational purposes and reflects Pniel Analytics’ experience delivering BI and analytics work. It is not legal, financial, or compliance advice. For guidance specific to your data environment, contact us at fsoh@pnielanalytics.com.