Pniel Analytics Stop stitching reports. Start making executive decisions.
Pniel Analytics transforms fragmented business data into automated Tableau and Power BI dashboards that drive faster, confident decisions.
Free · 30 minutes · no obligation
Three ways we turn data into decisions.
We build your dashboards, plan your data, and predict what’s coming next. Done deeply, not spread thin.
BI & Dashboards
Executive dashboards and automated reporting in Tableau and Power BI. One trusted, real-time view of performance, built for the people making the decisions.
Data Strategy
Roadmaps, metric governance, and integration that turn disconnected systems into one reliable foundation you can build on.
Advanced Analytics
Forecasting, segmentation, and predictive models that help you act on what’s coming, not just report what already happened.
Why Pniel, not a freelancer or a big firm?
The honest middle ground. Senior expertise, without the disappearing act or the six-figure invoice.
We start with your data, not your UI
Most dashboard designers focus on how it looks. We focus on how fast it runs. Around 80% of slow dashboards fail because of the queries behind them, not the design. We find the bottleneck and fix it at the source.
You save months, and often tens of thousands.
Freelancers disappear
A freelancer builds your dashboard and moves on. Six months later your data changes, the dashboard breaks, and there’s no one left to call.
We stand behind our work. If something breaks, fixing it is on us.
Big firms move slowly
A 16-week discovery phase. Junior analysts doing the work. Project managers relaying your words back to you. Four months and $200K later, you finally have a dashboard.
We deliver in 4 to 6 weeks, and you work directly with the person who builds it.
You get direct access
No sales engineer. No account manager. The person writing your SQL is the person you hired, and the same person stays with you the whole way.
We adapt to your business
Healthcare reporting works differently from retail, and retail works differently from government. We build for what you actually need, not for what fits a template.
Boutique by design
Staying small keeps us fast, focused, and efficient, without the overhead. It also means we recognize when you’d be better served by a larger firm. When that’s the case, we’ll tell you.
A structured path from raw data to lasting capability.
Every phase keeps your stakeholders aligned and your decisions moving.
1. Discover
We start with the decisions you need to make, then work back to the KPIs, stakeholders, and source systems behind them.
2. Build
We design the data flows and the dashboards together, checking in with you at every milestone so nothing comes as a surprise.
3. Enable
We launch, train your team, and document everything, so you can run it and extend it without us.
What our clients say
“Fred did an excellent job of developing a clean, branded dashboard that gives multiple audiences a solid overview of our work.”
Leslie Tresun, Learning & Evaluation Specialist
Dashboards we’ve built
Sample builds across healthcare, finance, retail and more.
- Patient Assessment Analytics Dashboard — A Tableau dashboard that gives healthcare teams one place to track patient assessments, watch outcomes, and spot where care needs attention.
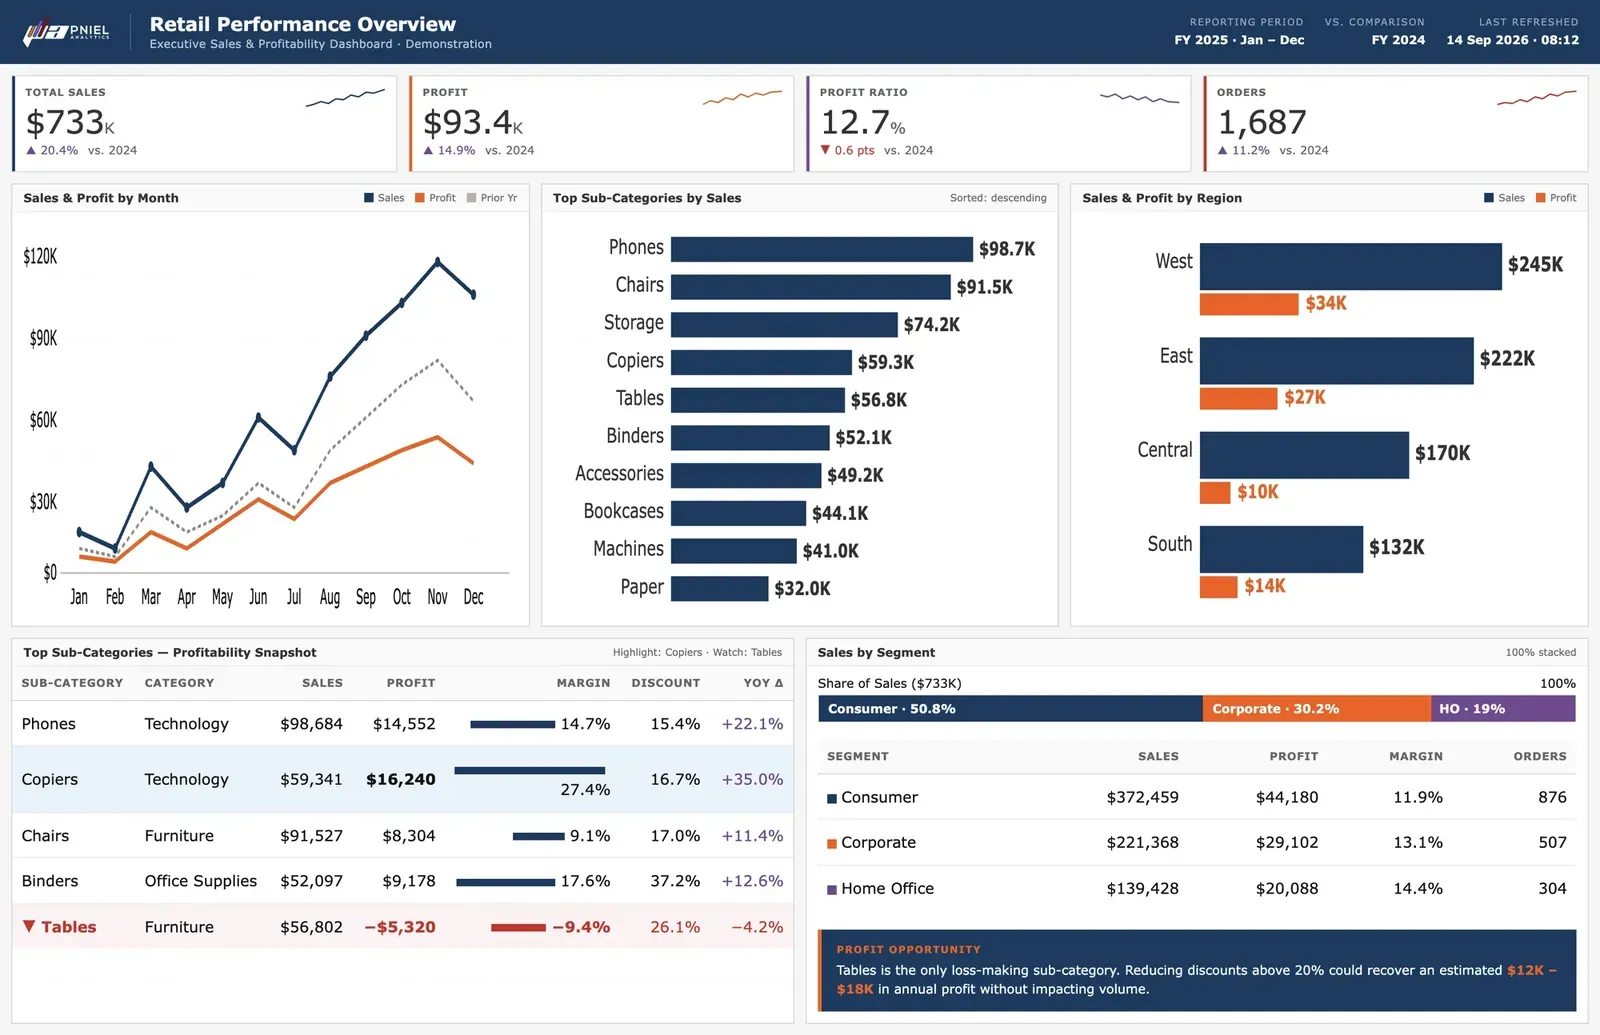
- Sales Performance Dashboard (Power BI) — A Power BI sales dashboard bringing revenue, margin, orders and average order value into one executive view, with drill-down by month, region and category.
- KPI Progress Overview Dashboard — A Tableau KPI tracker that scores goals against actuals with clear on-track, at-risk, and off-track status so teams always know where they stand.
- Financial Statement Overview Dashboard — An interactive Tableau dashboard for financial statements that helps stakeholders track performance and spot trends without digging through spreadsheets.
- Maryland Crime Rate Analysis Dashboard — Explore Maryland violent crime trends from 1975 to 2020 in an interactive Tableau dashboard, with county-level breakdowns built on publicly available open data.
- E-commerce KPI Dashboard — A live dashboard tracking revenue, conversion rate, average order value, and customer acquisition cost for an online store.