How we approached it
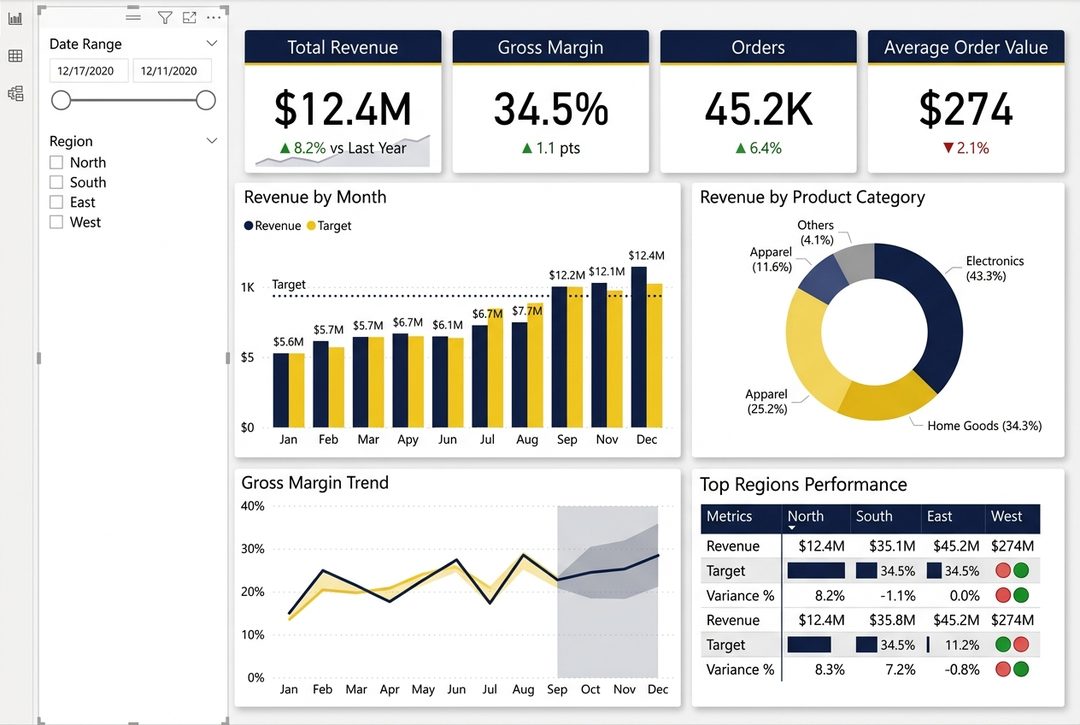
Sample build. This Power BI dashboard shows how we turn raw sales data into an executive view: KPI cards for revenue, gross margin, orders, and average order value up top, then a revenue-by-month column chart, a margin trend line, a category breakdown, and a top-regions matrix. It demonstrates our Power BI approach — a clean semantic model, DAX measures, and a layout built for fast decisions. We build equivalents on your own data.
The results
- Revenue, margin, orders, and AOV in one view
- Drill down by month, region, and product category
- Built on a clean Power BI semantic model with DAX