How we approached it
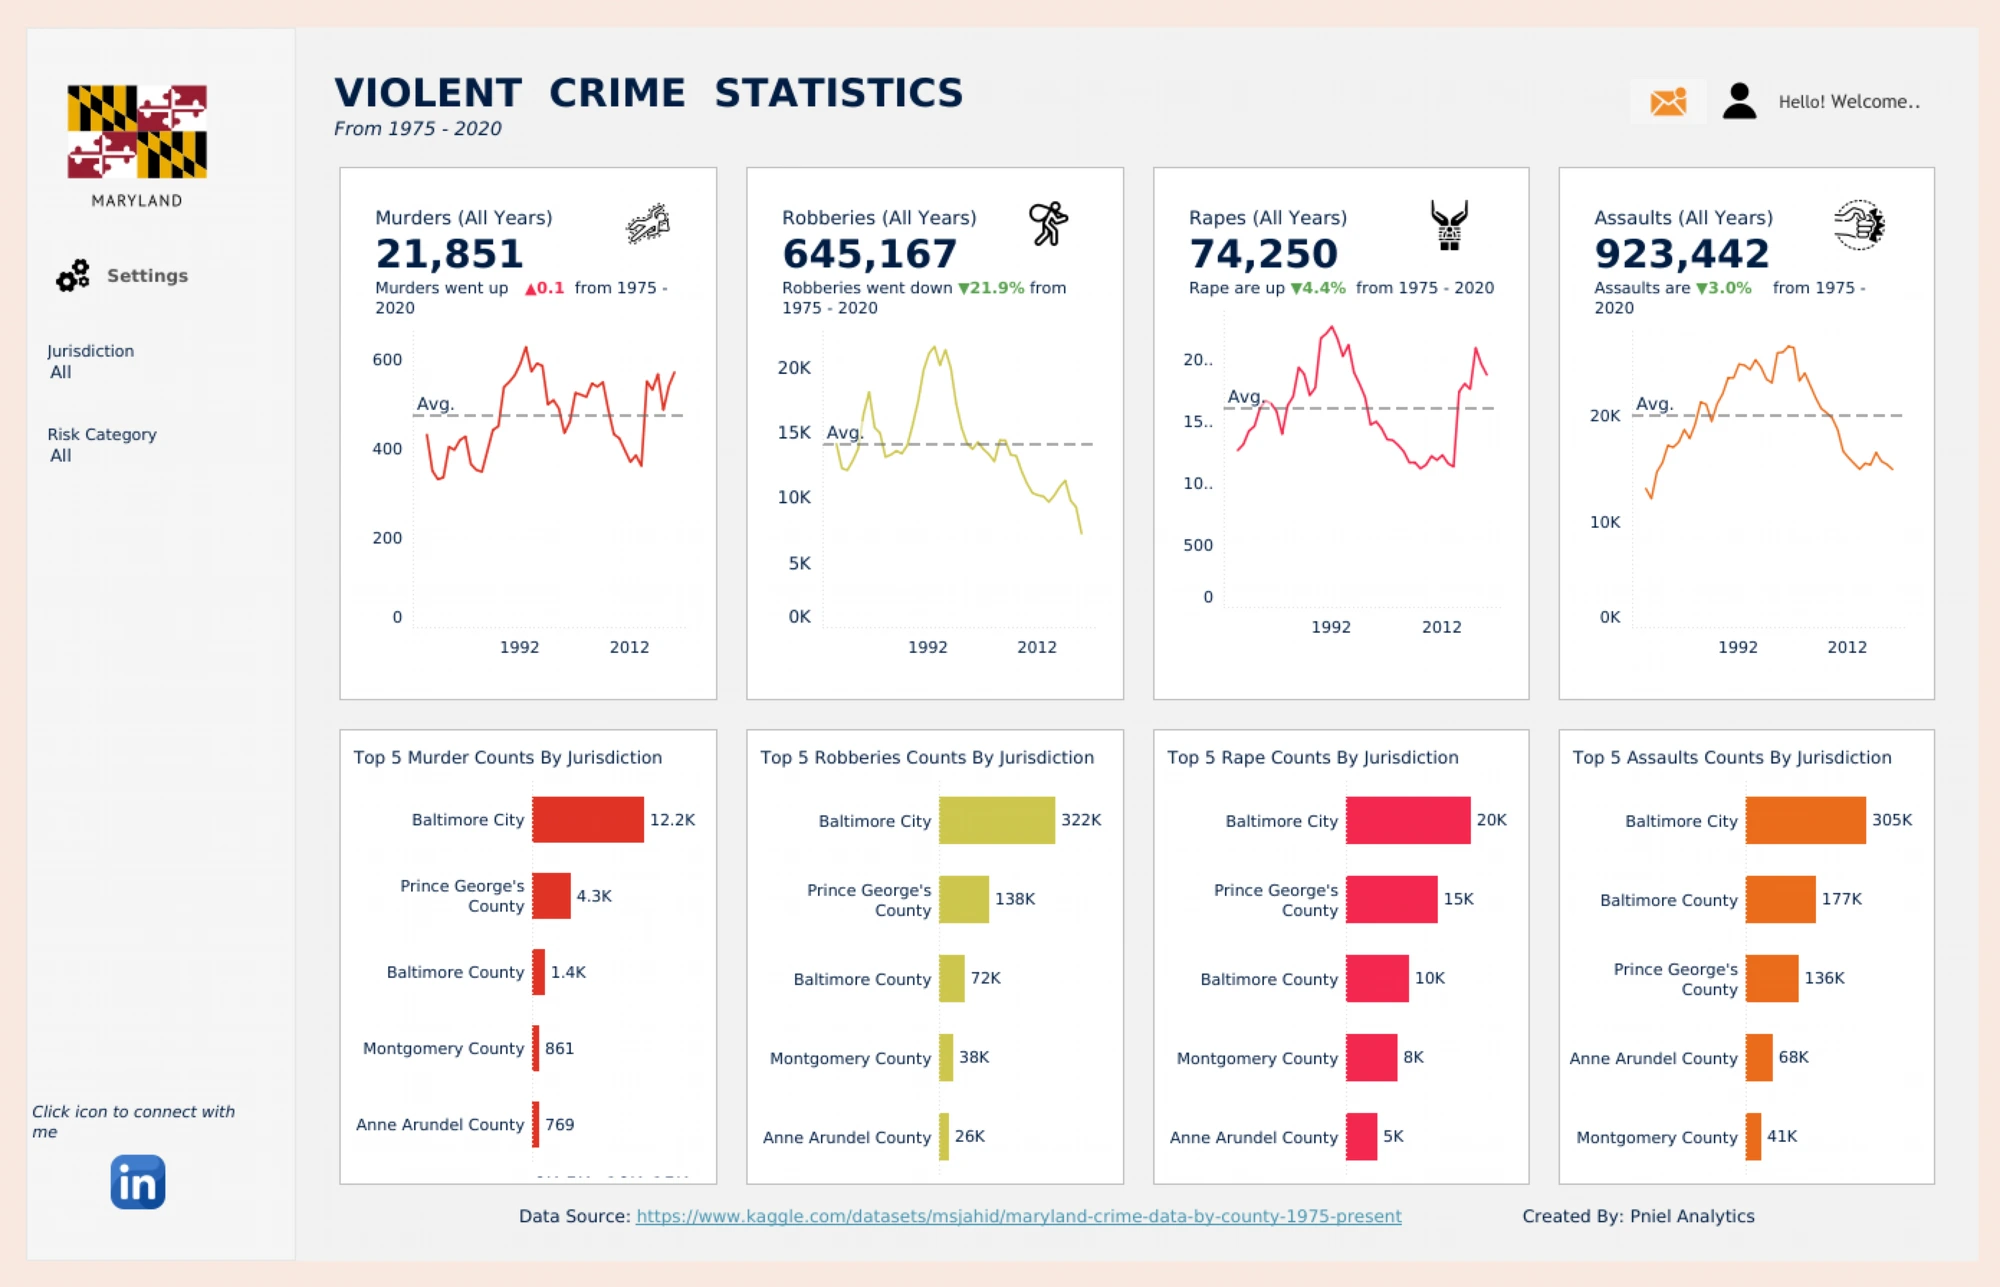
This is a self-directed portfolio project. Using public Maryland crime data from 1975 to 2020, we mapped how violent crime shifted across counties over five decades. The dashboard breaks out murders, robberies, rapes, and assaults, with year-over-year trend lines and top-jurisdiction comparisons. It shows how we work: source the open data, shape it into a clean model, then design a view that makes forty-five years of trends easy to read. It's the same process we bring to client work.
The results
- Multi-decade crime trends (1975 to 2020) visualized across all counties
- Clear category and top-jurisdiction breakdowns for fast comparison
- Built entirely on publicly available open data